. 2017 Jun 19;7(1):3775.
doi: 10.1038/s41598-017-03723-8.

Investigating the Life Expectancy and Proteolytic Degradation of Engineered Skeletal Muscle Biological Machines

Affiliations

Investigating the Life Expectancy and Proteolytic Degradation of Engineered Skeletal Muscle Biological Machines

Caroline Cvetkovic et al. Sci Rep. .

Abstract

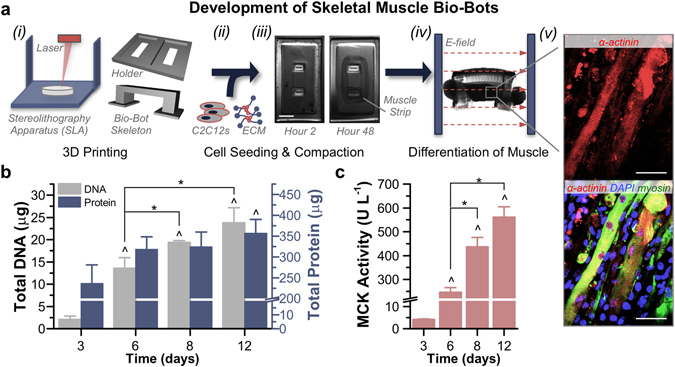
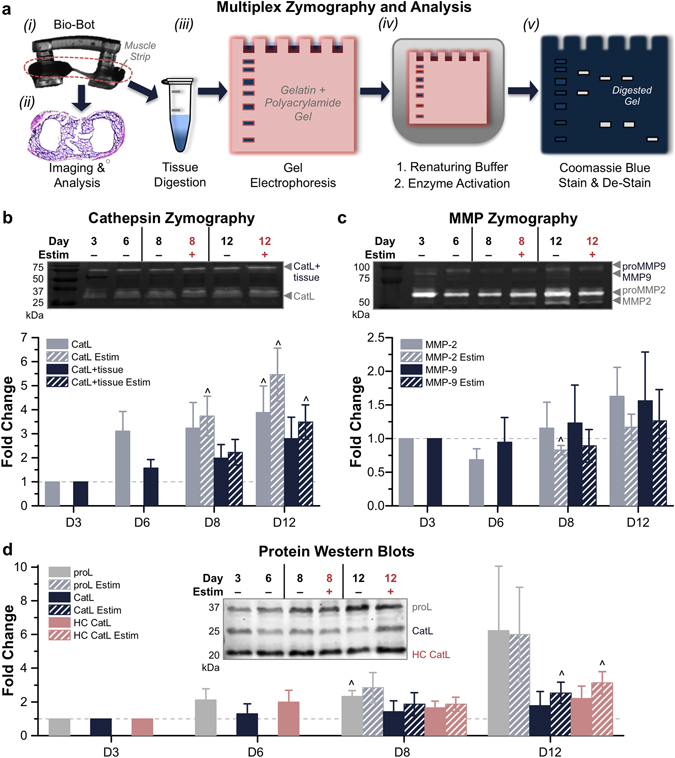
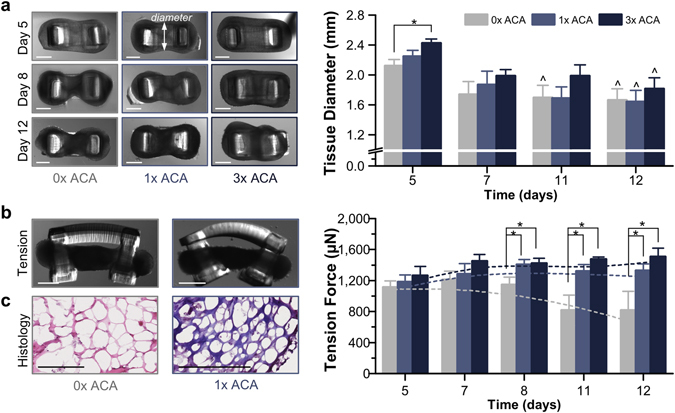
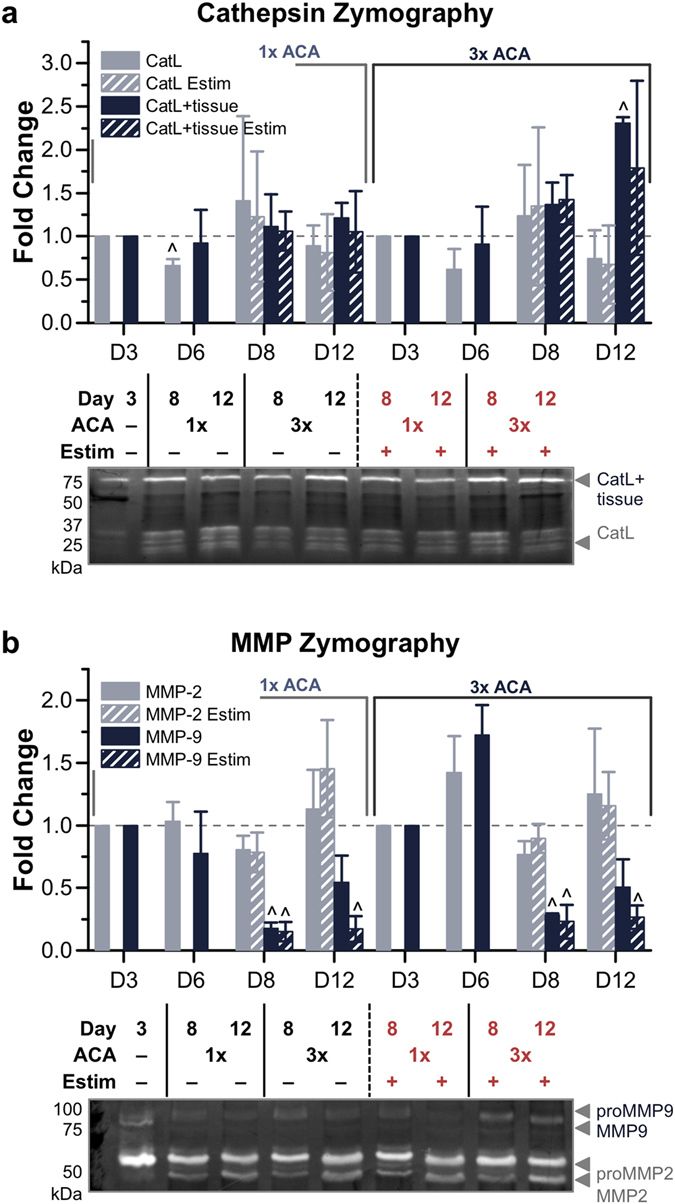
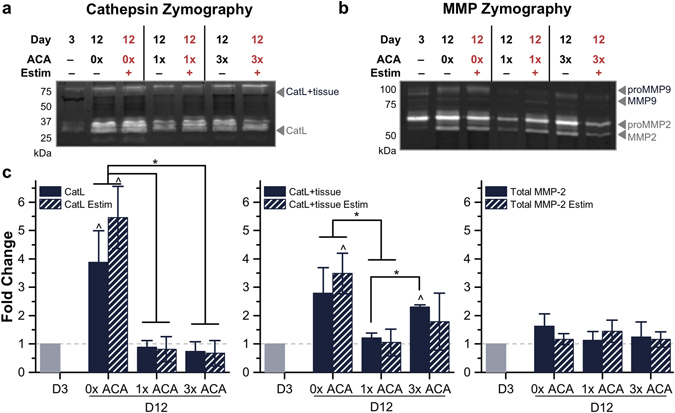
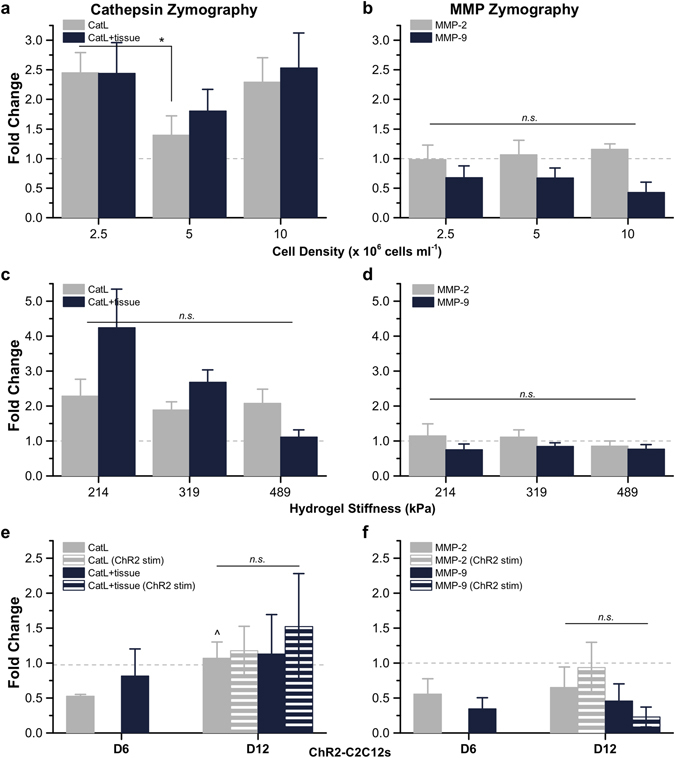
A combination of techniques from 3D printing, tissue engineering and biomaterials has yielded a new class of engineered biological robots that could be reliably controlled via applied signals. These machines are powered by a muscle strip composed of differentiated skeletal myofibers in a matrix of natural proteins, including fibrin, that provide physical support and cues to the cells as an engineered basement membrane. However, maintaining consistent results becomes challenging when sustaining a living system in vitro. Skeletal muscle must be preserved in a differentiated state and the system is subject to degradation by proteolytic enzymes that can break down its mechanical integrity. Here we examine the life expectancy, breakdown, and device failure of engineered skeletal muscle bio-bots as a result of degradation by three classes of proteases: plasmin, cathepsin L, and matrix metalloproteinases (MMP-2 and MMP-9). We also demonstrate the use of gelatin zymography to determine the effects of differentiation and inhibitor concentration on protease expression. With this knowledge, we are poised to design the next generation of complex biological machines with controllable function, specific life expectancy and greater consistency. These results could also prove useful for the study of disease-specific models, treatments of myopathies, and other tissue engineering applications.


Conflict of interest statement

The authors declare that they have no competing interests.

Figures

Figure 1
Figure 1
Development and Differentiation of Skeletal Muscle Bio-Bots. (a) Modular bio-bots were assembled and differentiated in a stepwise manner. (i) A Stereolithography apparatus (SLA) was used to 3D print a millimeter-scale hydrogel skeleton and holder. (ii) C2C12s were mixed with a liquid solution of ECM proteins that included fibrinogen, thrombin and Matrigel. (iii) When added to the holder, the cell-gel solution compacted to form a solid muscle strip. Scale bar, 2 mm. (iv) The freestanding bio-bot (consisting of the muscle strip coupled to the hydrogel skeleton) could be released from the holder and subjected to electrical or optical stimulation. (v) Immunostaining revealed the presence of striated and multinucleated myotubes (α-actinin, red; MF-20 myosin, green; DAPI nuclear stain, blue). Scale bar, 50 μm. (b) Total DNA and protein levels increased over the time course of the experiment (n = 3–4 muscle strips per time point). There was no statistically significant difference in protein/DNA ratios between days 8 (17 ± 2.8 μg protein μg DNA−1) and 12 (15.7 ± 2.5 μg protein μg DNA−1). (c) Muscle creatine kinase (MCK) activity was significantly increased as early as day 6 and reached a maximum output on day 12 (n = 3 muscle strips per time point). The rate of increased MCK activity slowed between days 8 and 12, confirming that this was a relevant stopping point for the experiments. All plots represent mean ± SEM. * indicates significance (p < 0.05) between conditions at the same time point; ^ indicates significance compared to initial time point.
Figure 2
Figure 2
Gelatin Zymography of Cathepsins and MMPs without ACA. (a) Muscle strip zymography process flow. (i) Degrading muscle strips were removed from hydrogel skeletons. (ii) Muscle strips could be fixed and stained for further analysis. (iii) Tissues were digested in lysis buffer. Isolated proteins were run through gel electrophoresis. (iv) Gels were incubated in renaturing and assay buffers. (v) Gels were stained with Coomassie Blue; bright bands indicated the activity of specific proteases, which were separated by molecular weight. (b) Cathepsin zymography identified the activity of CatL and CatL + tissue at days 3, 6, 8 and 12, in the presence or absence of electrical stimulation (n = 3–5 muscle strips per condition). (c) MMP zymography identified the activity of MMP-2 and MMP-9 at days 3, 6, 8 and 12, in the presence or absence of electrical stimulation (n = 3–5 muscle strips per condition). For MMP zymograms, upper bands reflect inactive enzyme (proMMP) and lower bands reflect active enzyme. (d) Western blotting confirmed the presence of cathepsins and related proteins, such as CysC (n = 3–5 muscle strips per condition). All plots represent mean ± SEM. ^ indicates significance (p < 0.05) compared to initial time point.
Figure 3
Figure 3
Bio-Bot Life Expectancy. (a) In the absence of any anti-fibrinolytic treatment (0x ACA), muscle strips demonstrated an average life expectancy of 8.2 ± 0.5 days until rupture. However, incubation in medium with the serine protease inhibitor ACA lengthened the life expectancy of the muscle strips. Box plots represent 25th, 50th and 75th percentiles, with average values marked as (x) and whiskers representing ± SEM. Data are presented to the left of the boxes (n = 6–13 muscle strips per condition, excluding outliers). * indicates significance (p < 0.05) between time points. (b) Kaplan-Meier survival analysis provided an additional method of comparison by plotting survival fraction of each treatment group as a function of time.
Figure 4
Figure 4
Loss of Tissue Structure and Mechanical Integrity. (a) Muscle strips began to degrade (most notably, in the middle region of the tissue), as shown in top-view images. Though the diameters of all groups on day 12 were reduced, the addition of 3x ACA helped to maintain the integrity of the tissue longer (n = 2–9 muscle strips per condition). Scale bar, 1 mm. (b) Muscle strips cultured without ACA displayed a lower passive tension and faster decrease in static force over time. After day 8, the passive tension was significantly lower for 0x muscle strips (n = 4–7 per time point) compared to both 1x (n = 5–6 per time point) and 3x ACA (n = 5–7 per time point). Scale bar, 1 mm. All plots represent mean ± SEM. * indicates significance (p < 0.05) between conditions at the same time point; ^ indicates significance compared to initial time point. (c) Histological staining for Masson’s Trichrome indicated that the addition of ACA helped to maintain the ECM in muscle strips. Scale bar, 200 μm.
Figure 5
Figure 5
Gelatin Zymography of Cathepsins and MMPs with 1x and 3x ACA. (a) Cathepsin zymography identified the amount of active CatL and CatL + tissue at days 3, 6, 8 and 12, in the presence or absence of electrical stimulation, for 1x and 3x ACA (n = 3–6 muscle strips per condition). (b) MMP zymography identified the amount of active MMP-2 and MMP-9 at days 3, 6, 8 and 12, in the presence or absence of electrical stimulation, for 1x and 3x ACA (n = 4–7 muscle strips per condition). All plots represent mean ± SEM. ^ indicates significance (p < 0.05) compared to initial time point.
Figure 6
Figure 6
Comparison of Active Cathepsins and MMPs in 0x, 1x and 3x ACA Cultured Muscle Strips. (a) Cathepsin zymography identified the amount of active CatL and CatL + tissue and (b) MMP zymography identified the amount of active MMP-2 and MMP-9, with and without electrical stimulation, for day 12 conditions compared to the initial time point of day 3. (c) ACA prolonged the lifetime and reduced the amount of active CatL in locomoting biological machines. All plots represent mean ± SEM. * indicates significance (p < 0.05) between conditions at the same time point; ^ indicates significance compared to initial time point.
Figure 7
Figure 7
Gelatin Zymography of Cathepsins and MMPs in Muscle Strips with Varying Cell Density, Hydrogel Skeleton Stiffness and Applied Stimulation. (a) For day 12 muscle strips cultured with 1x ACA and fabricated with varying cell densities (2.5, 5, or 10 × 106 cells ml−1), cathepsin zymography identified the amount of active CatL and CatL + tissue and (b) MMP zymography identified the amount of active MMP-2 and MMP-9 (n = 7−10 muscle strips per condition). (c) For day 12 muscle strips cultured with 1x ACA with a hydrogel skeleton stiffness of 214, 319, or 489 kPa, cathepsin zymography identified the amount of active CatL and CatL + tissue and (d) MMP zymography identified the amount of active MMP-2 and MMP-9 (n = 9−17 muscle strips per condition). (e) For ChR2-C2C12 optogenetic muscle strips, cathepsin zymography identified the amount of active CatL and CatL + tissue at days 6 and 12 and (f) MMP zymography identified the amount of active MMP-2 and MMP-9 at days 6 and 12, in the presence or absence of optogenetic stimulation (n = 3 muscle strips per condition). All plots represent mean ± SEM. * indicates significance (p < 0.05) between conditions at the same time point; ^ indicates significance compared to initial time point (day 6 for panels (e and f).

Similar articles

Cited by

References

    1. Kamm, R. D. & Bashir, R. Creating Living Cellular Machines. Ann. Biomed. Eng. doi:10.1007/s10439-013-0902-7 (2013). - PMC - PubMed
    1. Duffy RM, Feinberg AW. Engineered skeletal muscle tissue for soft robotics: fabrication strategies, current applications and future challenges. WIREs Nanomed Nanobiotechnol. 2014;6:178–195. doi: 10.1002/wnan.1254. - DOI - PubMed
    1. Dennis RG, Kosnik PE. Excitability and isometric contractile properties of mammalian skeletal muscle constructs engineered in vitro. Vitr. Cell. Dev. Biol. - Anim. 2000;36:327–335. doi: 10.1290/1071-2690(2000)036<0327:EAICPO>2.0.CO;2. - DOI - PubMed
    1. Cvetkovic C, et al. Three-dimensionally printed biological machines powered by skeletal muscle. Proc. Natl. Acad. Sci. USA. 2014;111:10125–10130. doi: 10.1073/pnas.1401577111. - DOI - PMC - PubMed
    1. Raman R, et al. Optogenetic skeletal muscle-powered adaptive biological machines. Proc. Natl. Acad. Sci. USA. 2016;113:3497–3502. doi: 10.1073/pnas.1516139113. - DOI - PMC - PubMed

Publication types

Substances

LinkOut - more resources