. 2017 Jun 19;7(1):3792.
doi: 10.1038/s41598-017-03359-8.

Multicolor two-photon imaging of endogenous fluorophores in living tissues by wavelength mixing

Affiliations

Multicolor two-photon imaging of endogenous fluorophores in living tissues by wavelength mixing

Chiara Stringari et al. Sci Rep. .

Abstract

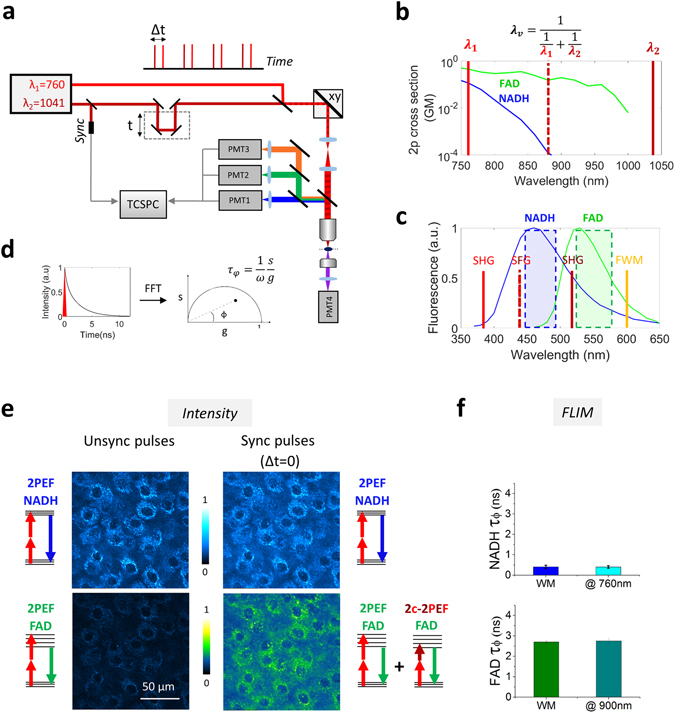
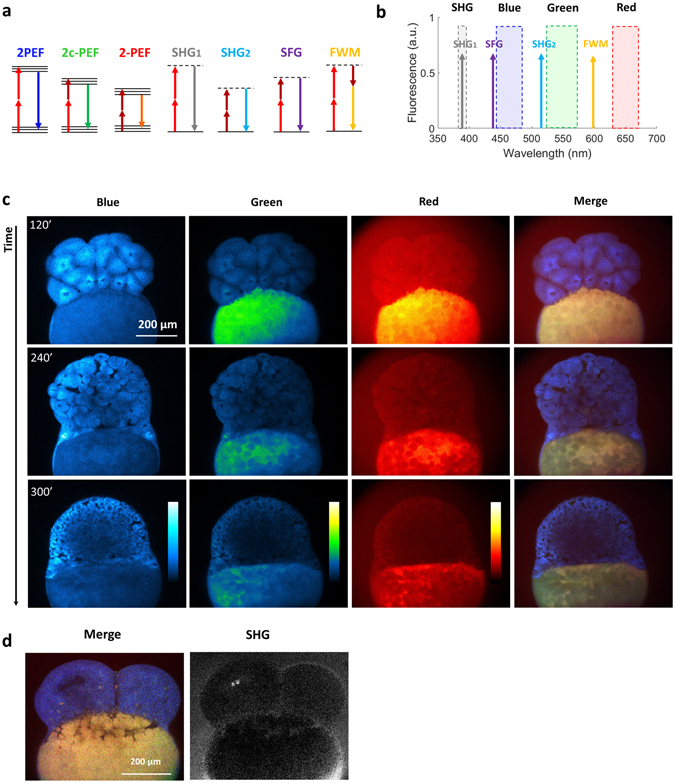
Two-photon imaging of endogenous fluorescence can provide physiological and metabolic information from intact tissues. However, simultaneous imaging of multiple intrinsic fluorophores, such as nicotinamide adenine dinucleotide(phosphate) (NAD(P)H), flavin adenine dinucleotide (FAD) and retinoids in living systems is generally hampered by sequential multi-wavelength excitation resulting in motion artifacts. Here, we report on efficient and simultaneous multicolor two-photon excitation of endogenous fluorophores with absorption spectra spanning the 750-1040 nm range, using wavelength mixing. By using two synchronized pulse trains at 760 and 1041 nm, an additional equivalent two-photon excitation wavelength at 879 nm is generated, and achieves simultaneous excitation of blue, green and red intrinsic fluorophores. This method permits an efficient simultaneous imaging of the metabolic coenzymes NADH and FAD to be implemented with perfect image co-registration, overcoming the difficulties associated with differences in absorption spectra and disparity in concentration. We demonstrate ratiometric redox imaging free of motion artifacts and simultaneous two-photon fluorescence lifetime imaging (FLIM) of NADH and FAD in living tissues. The lifetime gradients of NADH and FAD associated with different cellular metabolic and differentiation states in reconstructed human skin and in the germline of live C. Elegans are thus simultaneously measured. Finally, we present multicolor imaging of endogenous fluorophores and second harmonic generation (SHG) signals during the early stages of Zebrafish embryo development, evidencing fluorescence spectral changes associated with development.


Conflict of interest statement

The authors declare that they have no competing interests.

Figures

Figure 1
Figure 1
Principle of efficient multicolor two-photon fluorescence lifetime imaging of endogenous fluorophores (a) Pulse trains from dual-output femtosecond laser (λ1 = 760 nm, λ2 = 1041 nm) are synchronized using a delay line and co-aligned in the microscope. Pulse synchronization gives rise to two-beam processes such as sum-frequency generation (SFG), two-color two-photon excited fluorescence and four wave mixing (FWM). Fluorescence signals are epi-detected in three different spectral channels, while SHG is forward detected. Time-correlated single photon counting (TCSPC) electronics measures the arrival time of the fluorescence photons with respect to the laser pulse. (b) Two-photon cross sections of NADH and FAD. By synchronizing the two beams we create a virtual wavelength for two-photon excitation λv = 2/(1/λ1 + 1/λ2) that corresponds to 879 nm. (c) Emission filters are chosen to select the emission of NADH and FAD and reject coherent signals such as SHG, SFG and FWM. (d) The multi-exponential fluorescence intensity decay is transformed with a Fourier transform (FFT) and the real (g) and imaginary (s) parts are plotted in the graphical phasor plot. (e) Two channels fluorescence images of NADH and FAD in reconstructed human skin using synchronized (Δt = 0) and unsynchronized (Δt = 1 ps) beams. Two-photon-excited fluorescence (2PEF) for NADH and FAD fluorophores occurs when fluorophores are excited at λ1. When the beams are synchronized (Δt = 0), FAD fluorescence is enhanced by two-color two-photon excited fluorescence (2c-2PEF). (f) Fluorescence lifetime of NADH and FAD is not affected when the fluorophores are two-photon excited by single wavelength or wavelength mixing. Measurements were performed in solution.
Figure 2
Figure 2
Simultaneous multiphoton FLIM imaging of NADH and FAD reveals a metabolic gradient in redox ratio and lifetime in reconstructed human skin associated with cell differentiation (a) Three-dimensional scheme of reconstructed human skin. Proliferating cells are located at the basal layer, right above the dermis, while differentiated cells are located on different layers above the basal layer. A metabolic gradient along the z-depth of the epidermis goes from an energetic metabolism dominated by glycolysis in the basal cells to one dominated by OXPHOS in the differentiated cells. (b) NADH and FAD intensities are acquired simultaneously at different depths of the epidermis. Two representative images are shown at two different depths within stratum basale and stratum granulosum. (c) Intensity redox ratio FAD/(NADH + FAD), calculated simultaneously from NADH and FAD intensities reveals heterogeneity within single planes and a z-gradient associated with cell differentiation. (d) NADH and FAD lifetime along the z-depth reveals a gradient associated with cell differentiation. Time per pixel, 160 µs. Triplicate experiments were performed.
Figure 3
Figure 3
Simultaneous multiphoton FLIM imaging of NADH and FAD reveals a metabolic gradient associated with stem cell differentiation in C.Elegans germ line (a) Scheme of the germ line of the C. Elegans. Stem cells that are located at the tip of the germ line; a metabolic gradient along the axis of the germ line goes from an energetic metabolism dominated by glycolysis in proliferating stem cells to one dominated by OXPHOS in the differentiated cells. (b, c) NADH and FAD intensities (b) and lifetimes (c) are simultaneously acquired. Time per pixel, 160 µs. Triplicate experiments were performed.
Figure 4
Figure 4
Multicolor two-photon efficient imaging of multiple endogenous fluorophores during early stages of zebrafish embryo development (a) Energy diagrams of two-photon excited fluorescence (2PEF) for blue and red fluorophores, two-color two-photon excited fluorescence (2c-2PEF) for green fluorophores, second harmonic generation (SHG), sum frequency generation (SFG) and four wave mixing (FWM). (b) Bandpass filters are chosen to select the emission of blue, green and red fluorophores rejecting coherent signals such as SHG, SFG and FWM. (c) Images of the blue, green, red fluorescence channel and SHG of the same zebrafish embryo at three different time points of development. Images of merged channels represent a shift in the spectroscopic characteristics of the yolk. (d) Multicolor two-photon and SHG images of the zebrafish embryo at 4 cell stage. Time per pixel, 40 µs. This experiment has been repeated in three independent samples.
Figure 5
Figure 5
Multicolor two-photon efficient imaging of endogenous fluorophores in zebrafish embryo Images of the blue, green, red fluorescence, second harmonic generation, and merged channels of a live zebrafish embryo recorded 48 hours post fertilization (a) Large-scale (stitched mosaic) image encompassing 2450 × 730 µm2. (b) Detail extracted from the large-scale image. Pixel size, 0.83 µm. Multicolor pixel acquisition time, 40 µs. Scale bar, 500 µm.

References

    1. Zipfel WR, Williams RM, Webb WW. Nonlinear magic: multiphoton microscopy in the biosciences. Nature Biotechnology. 2003;21:1368–1376. doi: 10.1038/nbt899. - DOI - PubMed
    1. Zipfel WR, et al. Live tissue intrinsic emission microscopy using multiphoton-excited native fluorescence and second harmonic generation. Proc Natl Acad Sci USA. 2003;100:7075–7080. doi: 10.1073/pnas.0832308100. - DOI - PMC - PubMed
    1. Campagnola PJ, L. L. Second-harmonic imaging microscopy for visualizing biomolecular arrays in cells, tissues and organisms. Nat Biotechnol. 2003;21:1356–1360. doi: 10.1038/nbt894. - DOI - PubMed
    1. Débarre D, et al. Imaging lipid bodies in cells and tissues using third-harmonic generation microscopy. Nat Methods. 2006;3:47–53. doi: 10.1038/nmeth813. - DOI - PubMed
    1. Heikal AA. Intracellular coenzymes as natural biomarkers for metabolic activities and mitochondrial anomalies. Biomark Med. 2010;4:241–263. doi: 10.2217/bmm.10.1. - DOI - PMC - PubMed

Publication types