. 2017 Jun 19;7(1):3838.
doi: 10.1038/s41598-017-03878-4.

Spatio-temporal analysis of coding and long noncoding transcripts during maize endosperm development

Affiliations

Spatio-temporal analysis of coding and long noncoding transcripts during maize endosperm development

Eun-Deok Kim et al. Sci Rep. .

Abstract

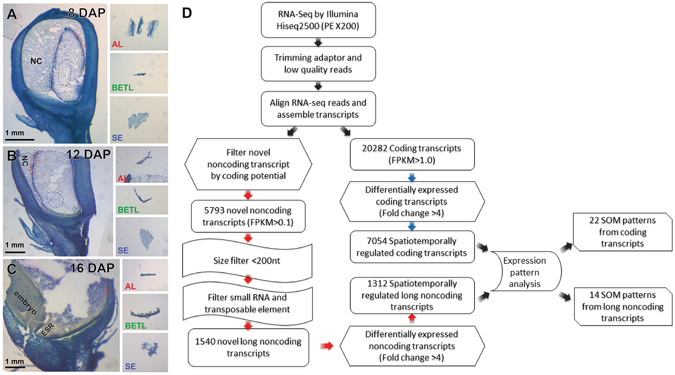
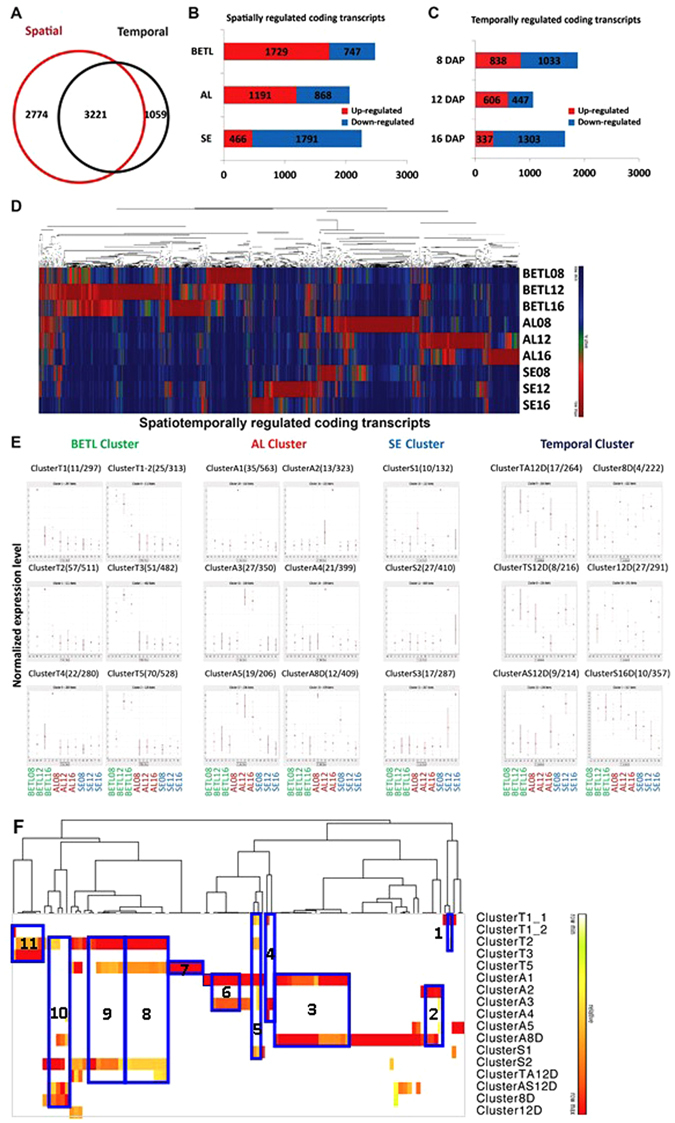
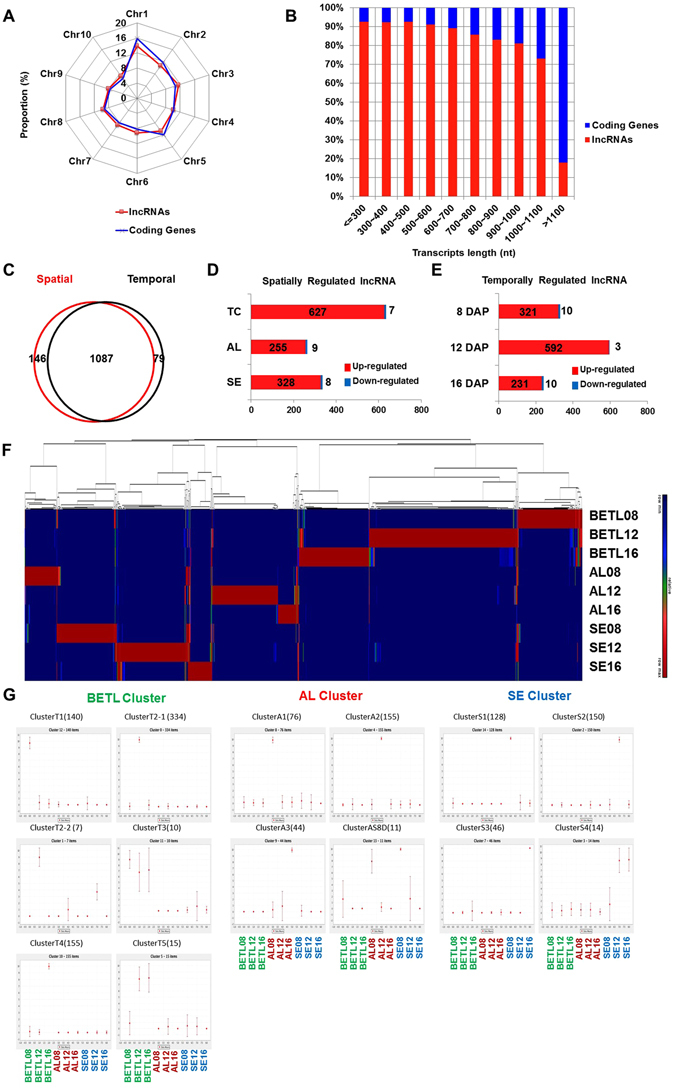
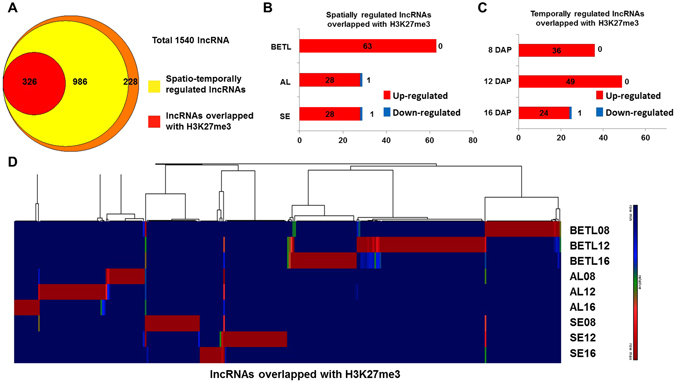
The maize endosperm consists of three major compartmentalized cell types: the starchy endosperm (SE), the basal endosperm transfer cell layer (BETL), and the aleurone cell layer (AL). Differential genetic programs are activated in each cell type to construct functionally and structurally distinct cells. To compare gene expression patterns involved in maize endosperm cell differentiation, we isolated transcripts from cryo-dissected endosperm specimens enriched with BETL, AL, or SE at 8, 12, and 16 days after pollination (DAP). We performed transcriptome profiling of coding and long noncoding transcripts in the three cell types during differentiation and identified clusters of the transcripts exhibiting spatio-temporal specificities. Our analysis uncovered that the BETL at 12 DAP undergoes the most dynamic transcriptional regulation for both coding and long noncoding transcripts. In addition, our transcriptome analysis revealed spatio-temporal regulatory networks of transcription factors, imprinted genes, and loci marked with histone H3 trimethylated at lysine 27. Our study suggests that various regulatory mechanisms contribute to the genetic networks specific to the functions and structures of the cell types of the endosperm.


Conflict of interest statement

The authors declare that they have no competing interests.

Figures

Figure 1
Figure 1
Schematic of method for transcriptome analysis of developing maize endosperm. (AC) HistoGene-stained frozen sections from kernels at (A) 8 DAP, (B) 12 DAP, and (C) 16 DAP. Three insets on the right side of each panel show the three tissue types isolated from cryo-sections by free-hand dissection. The tissues surrounded by the red dashed lines and the blue dashed lines correspond to the AL and SE tissue, respectively. The BETL is marked with green dashed lines. NC, nucellus. (D) The bioinformatics pipeline used to identify spatio-temporally regulated coding and long noncoding transcripts at three stages of the maize endosperm development.
Figure 2
Figure 2
Differential expression of coding transcripts during endosperm development. (A) Coding transcripts with FPKM >1.0 and with more than 4-fold expression-level changes were analysed; the overlap between spatially and temporally regulated are shown. (B) The numbers of coding transcripts that were up- or down-regulated more than 4 fold in any tissue are shown in box graphs. (C) The numbers of coding transcripts that were up- or down-regulated more than 4 fold at any DAP are shown in box graphs. (D) Hierarchical cluster analysis of spatio-temporally regulated coding transcripts. (E) SOM clusters are depicted based on clustering patterns. Given in parentheses is the number of co-expressed transcription factors and the number of genes that belong to each SOM cluster. The relative level of transcript is plotted on the y axis for each of nine samples: BETL08, BETL12, BETL16, AL08, AL12, AL16, SE08, SE12, and SE16 from left to right. (F) Functional GO-term enrichment. Significance is represented by heat map (-log10 P-value; red – high/white – low). Representative functional categories correspond to numbers on graph as follows: 1, defence response; 2, oxoacid metabolic process (oxidation reduction); 3, macromolecular complex subunit organization (chromatin assembly or disassembly, nucleosome assembly, protein-DNA packing); 4, lipid biosynthesis processes; 5, response to stimulus and stress; 6, response to abiotic stimulus and biotic stress (temperature); 7, microtubule-based process; 8, post translational process (phosphorylation, protein modifications); 9, regulation of metabolic/biosynthesis process; 10, regulation of transcription process; 10, macromolecule biosynthesis process; 11, establishment of localization.
Figure 3
Figure 3
Identification of long noncoding RNAs in the maize endosperm. (A) Distribution of lncRNAs along each chromosome. The proportion of coding transcripts and lncRNAs for each chromosome. (B) Size distributions of lncRNAs and coding transcripts. (C) Venn diagram of the number of spatially and/or temporally regulated lncRNAs with FPKM >0.01 and more than 4-fold expression-level changes. (D) The numbers of lncRNAs up- or down-regulated more than 4-fold in any tissue are shown. (E) The numbers of lncRNAs up- or down-regulated more than 4 fold at any DAP are shown. (F) Hierarchical cluster analysis of spatio-temporally regulated lncRNAs. (G) SOM clusters depicted based on clustering patterns. In parentheses are the number of co-expressed transcription factors and the number of genes that belong to each SOM cluster. The relative level of transcript is plotted on the y axis for each of nine samples: BETL08, BETL12, BETL16, AL08, AL12, AL16, SE08, SE12, and SE16 from left to right.
Figure 4
Figure 4
Spatio-temporally regulated lncRNA loci overlap with H3K27me3-marked loci. (A) Venn diagram representing the overlap between H3K27me3-enriched loci and spatio-temporally regulated lncRNA transcription sites. (B) The numbers of lncRNAs that overlap with H3K27me3 enriched loci that are up- or down-regulated more than 4-fold at any tissue are shown. (C) The numbers of lncRNAs that overlap with H3K27me3-enriched loci that were up- or down-regulated more than 4 fold at any DAP are shown. (D) Hierarchical cluster analysis of spatio-temporally regulated lncRNAs that overlap with H3K27me3-enriched loci.
Figure 5
Figure 5
Co-regulatory relationships between noncoding and coding transcripts. (A) Correlations between expression of lncRNA and neighbouring coding genes within 10 kb upstream and downstream of lncRNAs transcript loci were calculated for lncRNAs in each cluster. (B) The median value of an expression of lncRNAs and their neighbouring coding genes in each cluster. The relative level of transcript is plotted on the y axis for each of nine samples: BETL08, BETL12, BETL16, AL08, AL12, AL16, SE08, SE12, and SE16 from left to right. Blue lines plot data for coding genes and red lines lncRNAs. Red boxes indicate positive correlations and blue box indicates negative correlation. (C) The number of enriched cis-regulatory modules between each SOM cluster of lncRNAs and coding genes showing similar expression patterns.
Figure 6
Figure 6
Correlation among RNA expression, H3K27me3, and H3K4me3 in BETL at 8 DAP (TC08) and 16 DAP (TC16). (A) Schematic representation of the locations of amplicons used for ChIP assays. (B) Spatio-temporal enrichment of H3K27me3 at indicated loci plotted relative to GRM2G042582. (C) Spatio-temporal enrichment of H3K4me3 at indicated loci plotted relative to TXN (GRMZM2G066612). (D) mRNA expression at indicate loci relative to expression of TXN (GRMZM2G066612).

References

    1. Lopes MA, Larkins BA. Endosperm origin, development, and function. Plant Cell. 1993;5:1383–1399. doi: 10.1105/tpc.5.10.1383. - DOI - PMC - PubMed
    1. Olsen OA. ENDOSPERM DEVELOPMENT: Cellularization and Cell Fate Specification. Annual review of plant physiology and plant molecular biology. 2001;52:233–267. doi: 10.1146/annurev.arplant.52.1.233. - DOI - PubMed
    1. Olsen OA. Nuclear endosperm development in cereals and Arabidopsis thaliana. Plant Cell. 2004;16(Suppl):S214–227. doi: 10.1105/tpc.017111. - DOI - PMC - PubMed
    1. Sabelli PA, Larkins BA. The development of endosperm in grasses. Plant Physiol. 2009;149:14–26. doi: 10.1104/pp.108.129437. - DOI - PMC - PubMed
    1. Lafon-Placette C, Kohler C. Embryo and endosperm, partners in seed development. Curr Opin Plant Biol. 2014;17:64–69. doi: 10.1016/j.pbi.2013.11.008. - DOI - PubMed

Publication types

LinkOut - more resources