

doi: 10.1364/JOSAB.34.000104.
Epub 2016 Dec 14.
Gas-phase broadband spectroscopy using active sources: progress, status, and applications
Affiliations
- PMID: 28630530
- PMCID: PMC5473295
- DOI: 10.1364/JOSAB.34.000104
Item in Clipboard
Gas-phase broadband spectroscopy using active sources: progress, status, and applications
J Opt Soc Am B.
2017 Jan.
Abstract
Broadband spectroscopy is an invaluable tool for measuring multiple gas-phase species simultaneously. In this work we review basic techniques, implementations, and current applications for broadband spectroscopy. We discuss components of broad-band spectroscopy including light sources, absorption cells, and detection methods and then discuss specific combinations of these components in commonly-used techniques. We finish this review by discussing potential future advances in techniques and applications of broad-band spectroscopy.
Figures
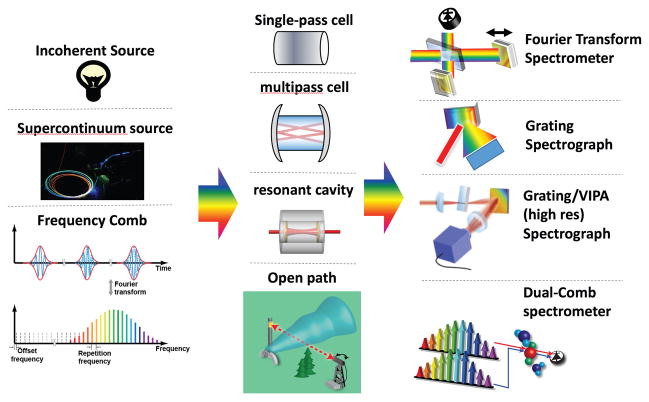
Overview of broadband spectroscopy systems. Left column: broad-band light sources. Middle column: absorption cells. Right column: broad-band detectors.
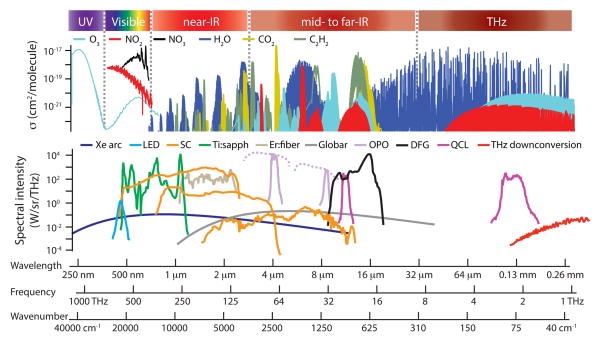
Example molecular cross sections and available sources in different spectral regions. For the laser based sources, we assume a 1 mrad divergence. For tunable sources, the tuning range is given by dashed lines. Cross-section data: [95] (NIR to THz), [148] (UV/Vis O3), [149] (vis NO2), [150] (vis NO3). Spectral source data: Xe arc lamp (blackbody at 6000 K, ε = 0.4, 450 W total power), blue LED (5W blue LedEngin LZ1-00B205), visible supercontinuum (estimate), Ti:sapphire comb with nonlinear fiber ([151]), Er:fiber comb with nonlinear fiber ([152]), near-IR supercontinuum ([120]), mid-IR supercontinuum ([122]), globar thermal source (blackbody at 1000 K, ε = 0.8, 140 W total power), periodically-poled litium niobate (PPLN) optical parametric oscillator (OPO) frequency comb ([141]), gallium phosphide (GaP) OPO comb ([142]), difference-frequency generation (DFG) ([146]), QCL frequency comb (two different sources, [153]), THz downconversion ([154]).
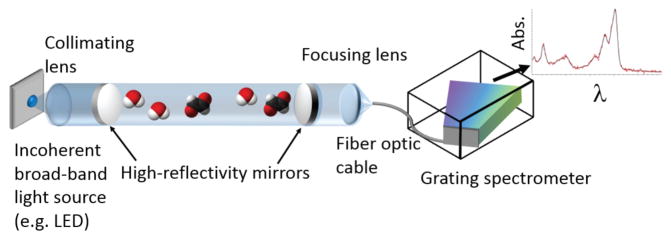
Example simplified schematic of IBB-CES and CE-DOAS setups. These consist of an incoherent light source, a collimating lens, a cavity made of a pair of highly reflective mirrors, a focusing lens after the cavity, and a fiber optic cable to transfer the light to the grating spectrometer. Data: example CE-DOAS glyoxal measurement (red: measured spectrum, black: fitted cross section).
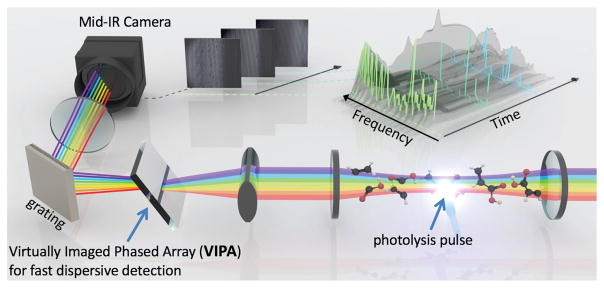
TRFCS. Laser light enters the cavity where a pulse starts the reaction through photolysis. Here, a VIPA spectrometer is used for detection. By measuring spectra at varying delays after the pulse, a complete kinetic picture can be determined (inset). Figure credit: The Ye Lab and Brad Baxley/JILA
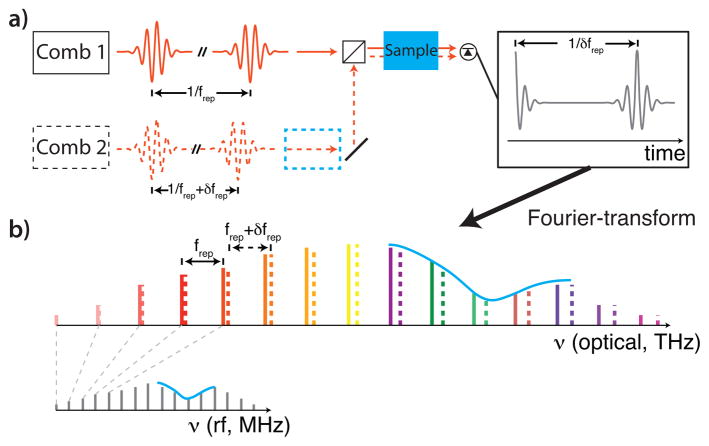
Dual comb spectroscopy, see text for details: (a) time-domain picture, (b) frequency-domain picture. The sample can be placed either before the combiner (dashed blue box) to measure both phase and absorbance or after the combiner (solid box) to measure only absorbance.
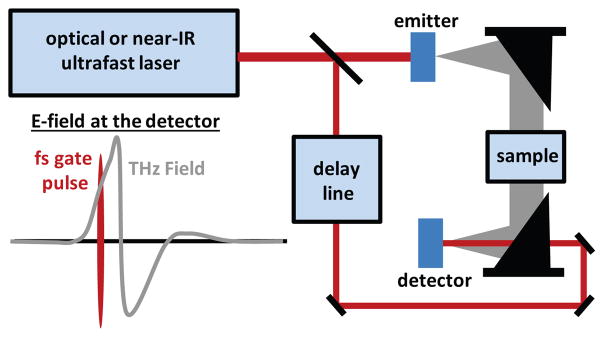
A generalized THz-TDS setup. The ultrafast pulses from an optical or near-IR laser are used to generate and detect THz transients. Detection is performed in the time domain with an optical delay line, and is sensitive to the THz electric field. This allows the measurement of the real and imaginary optical constants of a sample.
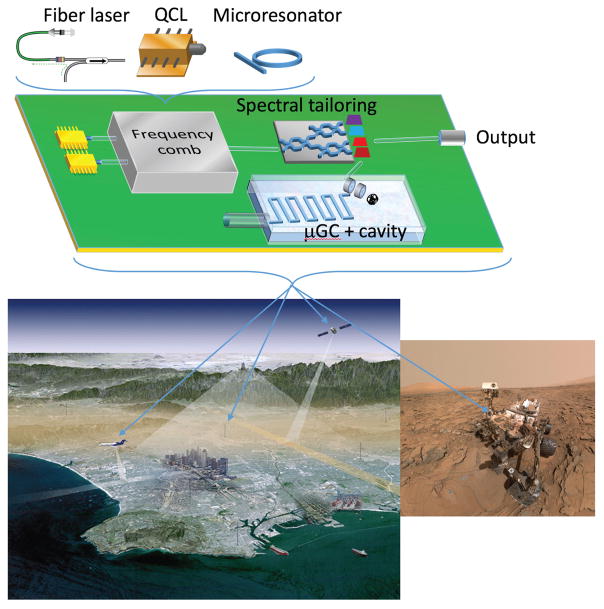
Outlook: A miniature broad-band light source (e.g., a fiber laser, mode-locked QCL, or mode-locked microresonator) is combined on-chip waveguides to produce light in targeted spectral bands for spectroscopy. A micro GC on a chip separates complex samples and sends molecules into a microcavity which allows for high sensitivity of the micro-comb (upper figure). Due to the small size and low power requirements, these instruments can be deployed on aircraft, satellites, or sensor networks in cities (lower left) or as instruments on rovers that visit other planets (lower right). Lower left and lower right figures courtesy of NASA/JPL-Caltech.
References
-
- Fraunhofer J. Denkschriften der Königlichen Akademie der Wissenschaften zu München für das Jahr 1814 und 1815. Vol. 5. Bayerische Akademie der Wissenschaften; München: 1817. Bestimmung des Brechungs- und des Farben-Zerstreuungs - Vermögens verschiedener Glasarten, in Bezug auf die Vervollkommnung achromatischer Fernröhre; pp. 193–226.
-
- Brand JCD. Lines of Light: The Sources of Dispersive Spectroscopy, 1800–1930. Gordon & Breach Publ; 1995.
-
- Tennyson J, Bernath PF, Campargue A, Császár AG, Daumont L, Gamache RR, Hodges JT, Lisak D, Naumenko OV, Rothman LS, Tran H, Zobov NF, Buldyreva J, Boone CD, De VMD, Gianfrani L, Hartmann JM, McPheat R, Weidmann D, Murray J, Ngo NH, Polyansky OL. Recommended isolated-line profile for representing high-resolution spectroscopic transitions (IUPAC Technical Report) Pure Appl Chem. 2014;86:1931–1943.
-
- Nozière B, Kalberer M, Claeys M, Allan J, D’Anna B, Decesari S, Finessi E, Glasius M, Grgić I, Hamilton JF, Hoffmann T, Iinuma Y, Jaoui M, Kahnt A, Kampf CJ, Kourtchev I, Maenhaut W, Marsden N, Saarikoski S, Schnelle-Kreis J, Surratt JD, Szidat S, Szmigielski R, Wisthaler A. The Molecular Identification of Organic Compounds in the Atmosphere: State of the Art and Challenges. Chem Rev. 2015;115:3919–3983. - PubMed
-
- Smith ML, Kort EA, Karion A, Sweeney C, Herndon SC, Yacovitch TI. Airborne Ethane Observations in the Barnett Shale: Quantification of Ethane Flux and Attribution of Methane Emissions. Environ Sci Technol. 2015;49:8158–8166. - PubMed
Grants and funding
LinkOut - more resources
Full Text Sources
Other Literature Sources