. 2017 Jun 12;3(1):vex012.
doi: 10.1093/ve/vex012. eCollection 2017 Jan.

Global patterns in coronavirus diversity

Affiliations

Global patterns in coronavirus diversity

Simon J Anthony et al. Virus Evol. .

Abstract

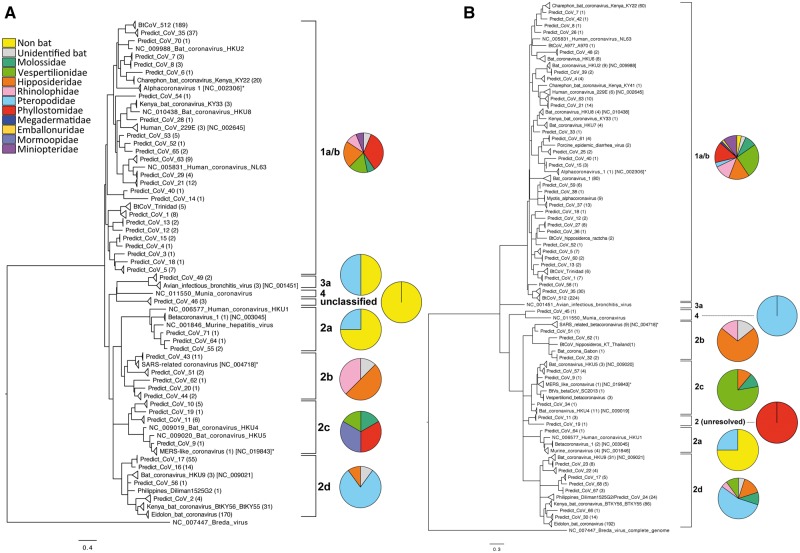
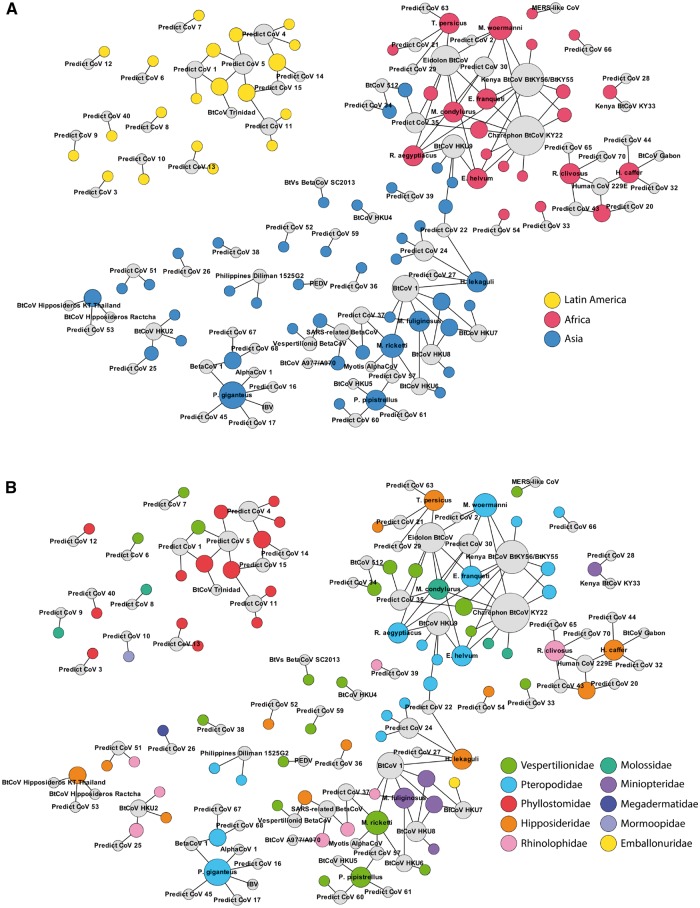
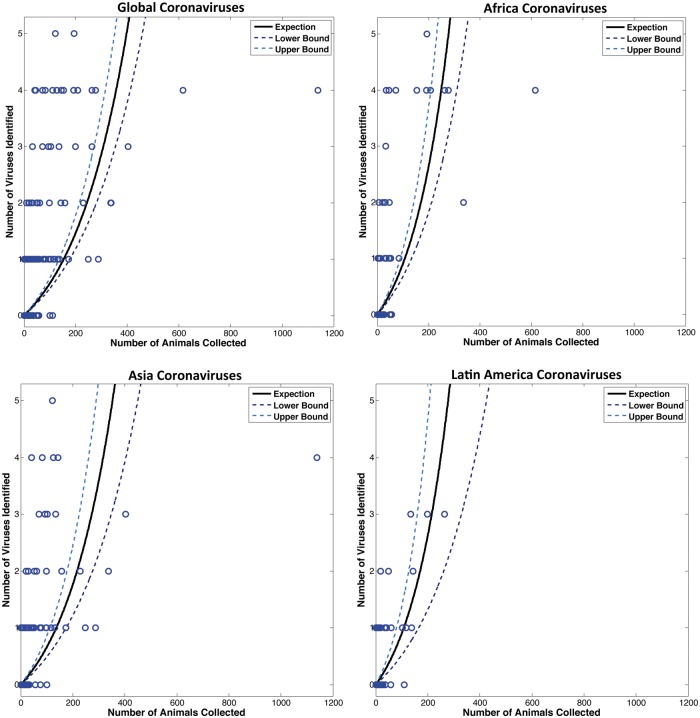
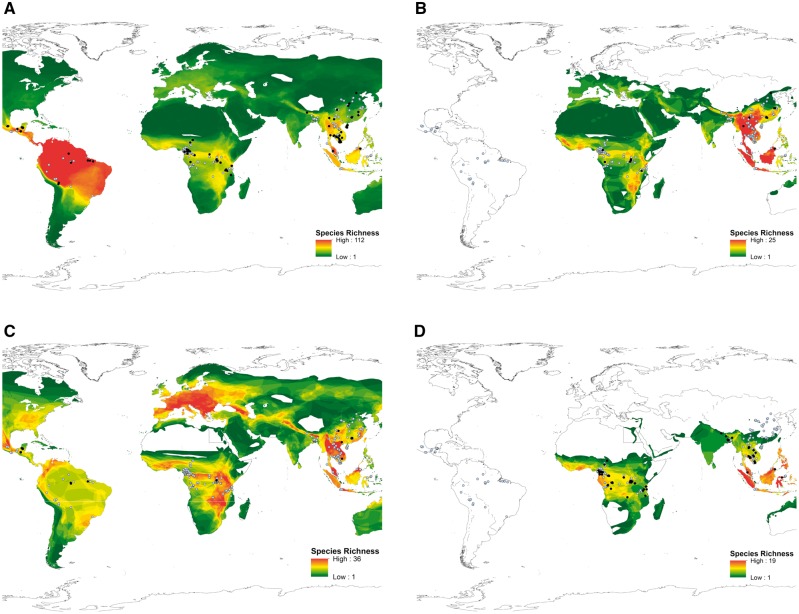
Since the emergence of Severe Acute Respiratory Syndrome Coronavirus (SARS-CoV) and Middle East Respiratory Syndrom Coronavirus (MERS-CoV) it has become increasingly clear that bats are important reservoirs of CoVs. Despite this, only 6% of all CoV sequences in GenBank are from bats. The remaining 94% largely consist of known pathogens of public health or agricultural significance, indicating that current research effort is heavily biased towards describing known diseases rather than the 'pre-emergent' diversity in bats. Our study addresses this critical gap, and focuses on resource poor countries where the risk of zoonotic emergence is believed to be highest. We surveyed the diversity of CoVs in multiple host taxa from twenty countries to explore the factors driving viral diversity at a global scale. We identified sequences representing 100 discrete phylogenetic clusters, ninety-one of which were found in bats, and used ecological and epidemiologic analyses to show that patterns of CoV diversity correlate with those of bat diversity. This cements bats as the major evolutionary reservoirs and ecological drivers of CoV diversity. Co-phylogenetic reconciliation analysis was also used to show that host switching has contributed to CoV evolution, and a preliminary analysis suggests that regional variation exists in the dynamics of this process. Overall our study represents a model for exploring global viral diversity and advances our fundamental understanding of CoV biodiversity and the potential risk factors associated with zoonotic emergence.

Keywords: bat; coronavirus; evolution; viral ecology.


Figures

Figure 1.
Figure 1.
Histogram of the relative frequency of pairwise sequence identities used to define the cutoff between operating taxonomic units for all CoV sequences detected. A bimodal distribution was observed and a cutoff of 90% sequence identity used to separate sequences from both the Watanabe (Panel A) and Quan (Panel B) assays into discrete viral taxa.
Figure 2.
Figure 2.
Maximum likelihood phylogenetic reconstructions for all partial CoV RdRp fragments for both the Quan (Panel A) and Watanabe (Panel B) assays. Sequences are collapsed into clades, representing our operating taxonomic units (sequences sharing ≥90% identity) and number of sequences for each taxon is indicated in parentheses. Representative published sequences from GenBank have been included for comparison (GenBank accession number indicated). Both trees were rooted using the related Breda virus (NC_007447) and all nodes have ≥60% bootstrap support. Pie charts indicate the distribution of viral taxa by host (bat) family, in each virus sub-clade.
Figure 3.
Figure 3.
Comparison of viral and bat diversity. The earth’s surface was divided into grid cells by latitude and longitude (10 × 10 degree units) for diversity calculations (Panel A). Grid cells where bats were sampled are numbered in each region. Alpha diversity (Shannon H) for virus (Panel B) and host (Panel C) were correlated, indicating that areas of high bat diversity also have high viral diversity. Darker cells indicate higher alpha diversity (i.e. more viral or host taxa) in each grid cell. Beta diversity was also correlated between virus (Panel D) and host (Panel E), and differentiated into three discrete communities by region—Latin America (grid cells 1–10), Africa (grid cells 11–20), and Asia (grid cells 21–34). Shading indicates that either viruses (in red) or hosts (in blue) are shared between two corresponding grid cells, with darker cells indicating higher pairwise similarity.
Figure 4.
Figure 4.
Network model showing the connection of CoVs and their hosts. Viral sequence clusters (colored grey) are connected to host species, either by region (Panel A) or family (Panel B). Viral and host and communities separate almost entirely by region; only Africa and Asia are connected by two shared viruses (HKU9 and PREDICT_CoV-35) found in species from both continents. Networks also show that viruses appear to be shared by multiple host families in Africa and Asia, while being more restricted to a single family in Latin America.
Figure 5.
Figure 5.
Relative proportion of evolutionary events leading to observed virus:host associations for CoVs in bats. Cophylogenetic reconstructions were used to identify each event (Supplementary Fig. S1: Panels A–D), and significance evaluated by region. Across all regions, host switching was the dominant evolutionary event (Panel A). When separated by region, host switching remained dominant in Africa (Panel B) and Asia (Panel C), but not in Latin America (Panel D).
Figure 6.
Figure 6.
Relationship between sampling effort and viral detection among all bat species sampled. A Poisson regression model was used to estimate the expected number of viruses based on the number of animals sampled, by species (each circle indicates a separate species). The 95% confidence intervals are indicated.
Figure 7.
Figure 7.
Viral diversity ‘hotspot’ maps. Panel A shows the potential hotspots for CoVs based on the distribution of bats worldwide. Location of alpha CoV sequences from this study are shown in black and beta CoV sequences in blue, indicating there is no geographical bias based on viral genus (i.e. alpha and beta CoVs are equally likely to be found in all regions). Some viral sub-clades were associated with particular bat families, and the spatial distribution data of all species belonging to these families were plotted to indicate the potential hotspots of viral diversity (richness) for these sub-clades. Panel B indicates the potential distribution of 2b CoVs based on the distribution of rhinolphus and hipposideros bats. Locations of 2b-positive animals identified in this study are indicated in black, and correlate with areas of high species richness (for these families). CoV-positive animals for other sub-clades shown in light blue. Panel C indicates the potential distribution of 2c CoVs based on the distribution of vespertilionid bats. Locations of 2c-positive animals identified in this study are indicated in black. This map suggests there are hotspots of 2c diversity in regions not covered in this study (e.g. Europe). Panel D indicates the potential distribution of 2d viruses based on the distribution of pteropid bats. The map suggests these viruses may have a more limited distribution, compared with viruses of other sub-clades. Locations of 2d-positive animals identified in this study are shown in black.

Comment in

References

    1. Anthony S. J. et al. (2012) ‘Coronaviruses in bats from Mexico’, Journal of General Virology, 94: 1028–38. - PMC - PubMed
    1. Anthony S. J., et al. (2015) ‘Non-random patterns in viral diversity’, Nature Communications, 6: 8147. - PMC - PubMed
    1. Anthony S. J., et al. (2017) ‘Further evidence for bats as the evolutionary source of MERS coronavirus’, mBio, 8/2. pii: e00373-17. doi: 10.1128/mBio.00373-17. - PMC - PubMed
    1. Azhar E. I. et al. (2014) ‘Evidence for camel-to-human transmission of MERS coronavirus’, The New England Journal of Medicine, 370: 2499–505. - PubMed
    1. Blackwood J. C. et al. (2013) ‘Resolving the roles of immunity, pathogenesis, and immigration for rabies persistence in vampire bats’, Proceedings of the National Academy of Sciences of the United States of America, 110: 20837–42. - PMC - PubMed