

Structural connectivity differences in motor network between tremor-dominant and nontremor Parkinson's disease
- PMID: 28631404
- PMCID: PMC6866900
- DOI: 10.1002/hbm.23697
Structural connectivity differences in motor network between tremor-dominant and nontremor Parkinson's disease
Abstract
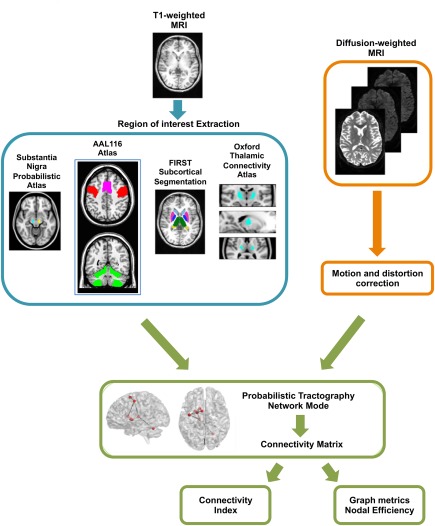
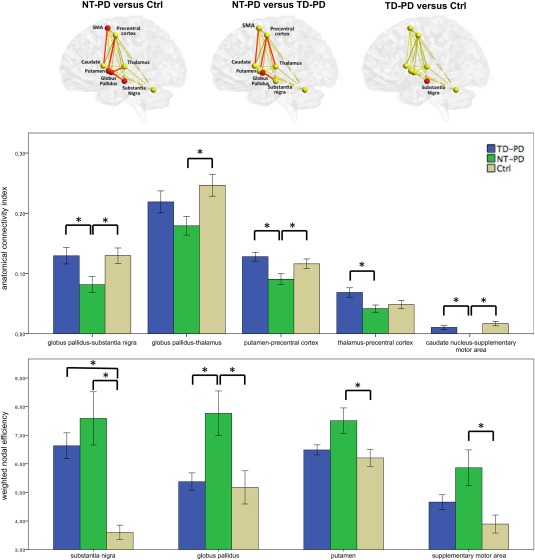
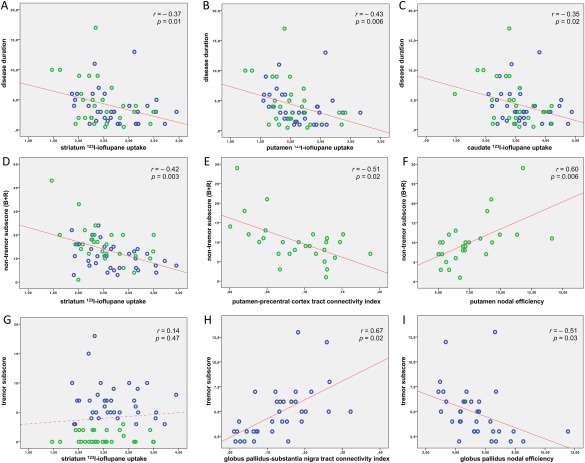
Motor phenotypes of Parkinson's disease (PD) are recognized to have different prognosis and therapeutic response, but the neural basis for this clinical heterogeneity remains largely unknown. The main aim of this study was to compare differences in structural connectivity metrics of the main motor network between tremor-dominant and nontremor PD phenotypes (TD-PD and NT-PD, respectively) using probabilistic tractography-based network analysis. A total of 63 PD patients (35 TD-PD patients and 28 NT-PD patients) and 30 healthy controls underwent a 3 T MRI. Next, probabilistic tractography-based network analysis was performed to assess structural connectivity in cerebello-thalamo-basal ganglia-cortical circuits, by measuring the connectivity indices of each tract and the efficiency of each node. Furthermore, dopamine transporter single-photon emission computed tomography (DAT-SPECT) with 123 I-ioflupane was used to assess dopaminergic striatal depletion in all PD patients. Both PD phenotypes showed nodal abnormalities in the substantia nigra, in agreement with DAT-SPECT evaluation. In addition, NT-PD patients displayed connectivity alterations in nigro-pallidal and fronto-striatal pathways, compared with both controls and TD-PD patients, in which the same motor connections seemed to be relatively spared. Of note, in NT-PD group, rigidity-bradykinesia score correlated with fronto-striatal connectivity abnormalities. These findings demonstrate that structural connectivity alterations occur in the cortico-basal ganglia circuit of NT-PD patients, but not in TD-PD patients, suggesting that these anatomical differences may underlie different motor phenotypes of PD. Hum Brain Mapp 38:4716-4729, 2017. © 2017 Wiley Periodicals, Inc.
Keywords: Parkinson's disease; dopamine transporter single-photon emission computed tomography; motor phenotypes of Parkinson's disease; nontremor Parkinson's disease; probabilistic tractography; structural network analysis; tremor-dominant Parkinson's disease.
© 2017 Wiley Periodicals, Inc.
Figures
References
-
- Aarsland D, Andersen K, Larsen JP, Lolk A, Kragh‐Sorensen P (2003): Prevalence and characteristics of dementia in Parkinson disease – An 8‐year prospective study. Arch Neurol 60:387–392. - PubMed
-
- Behrens TE, Woolrich MW, Jenkinson M, Johansen‐Berg H, Nunes RG, Clare S, Matthews PM, Brady JM, Smith SM (2003): Characterization and propagation of uncertainty in diffusion‐weighted MR imaging. Magn Reson Med 50:1077–1088. - PubMed
-
- Benamer HT, Patterson J, Wyper DJ, Hadley DM, Macphee GJ, Grosset DG (2000): Correlation of Parkinson's disease severity and duration with 123I‐FP‐CIT SPECT striatal uptake. Mov Disord 15:692–698. - PubMed
Publication types
MeSH terms
Substances
LinkOut - more resources
Full Text Sources
Other Literature Sources
Medical
Research Materials
