. 2017 Jun 20:8:15885.
doi: 10.1038/ncomms15885.

Plastid thylakoid architecture optimizes photosynthesis in diatoms

Affiliations

Plastid thylakoid architecture optimizes photosynthesis in diatoms

Serena Flori et al. Nat Commun. .

Abstract

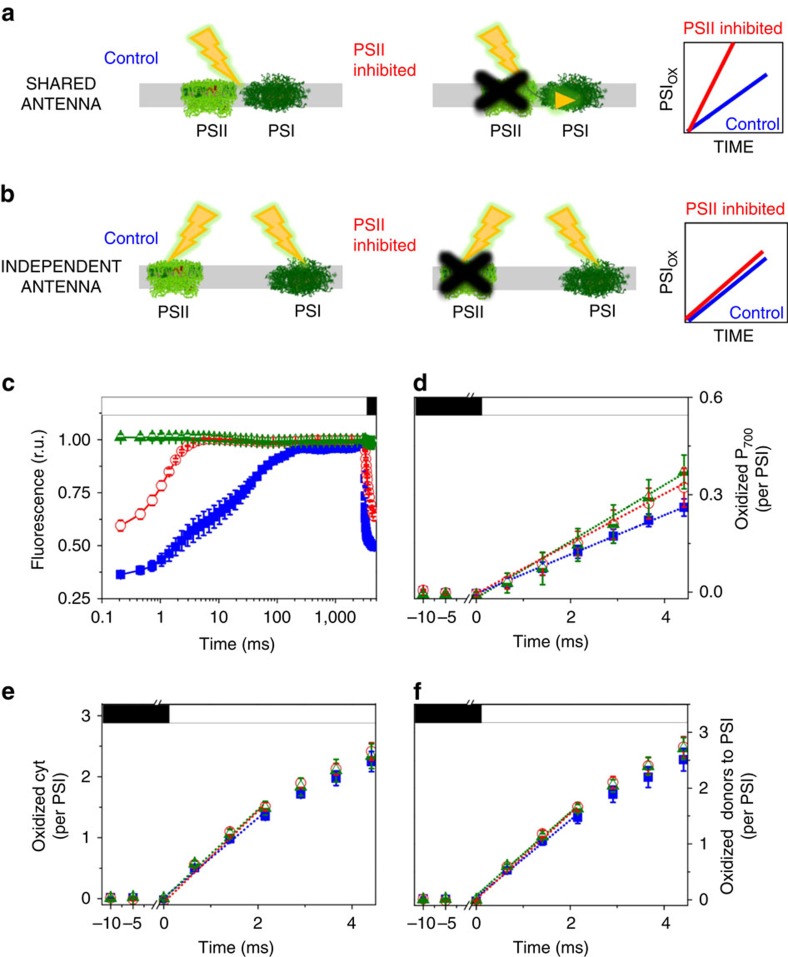
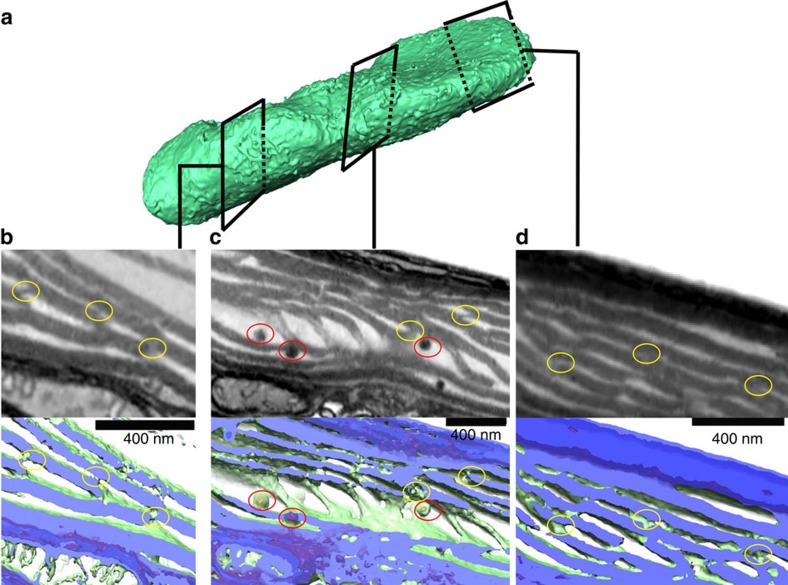
Photosynthesis is a unique process that allows independent colonization of the land by plants and of the oceans by phytoplankton. Although the photosynthesis process is well understood in plants, we are still unlocking the mechanisms evolved by phytoplankton to achieve extremely efficient photosynthesis. Here, we combine biochemical, structural and in vivo physiological studies to unravel the structure of the plastid in diatoms, prominent marine eukaryotes. Biochemical and immunolocalization analyses reveal segregation of photosynthetic complexes in the loosely stacked thylakoid membranes typical of diatoms. Separation of photosystems within subdomains minimizes their physical contacts, as required for improved light utilization. Chloroplast 3D reconstruction and in vivo spectroscopy show that these subdomains are interconnected, ensuring fast equilibration of electron carriers for efficient optimum photosynthesis. Thus, diatoms and plants have converged towards a similar functional distribution of the photosystems although via different thylakoid architectures, which likely evolved independently in the land and the ocean.


Conflict of interest statement

The authors declare no competing financial interests.

Figures

Figure 1
Figure 1. Experimental design used to assess energy spillover in diatoms.
Expected effects of energy spillover from PSII to PSI on PSI activity: physical contact between both PSs (a), disconnected PSs (b). (c) Fluorescence emission kinetics confirm full inhibition of PSII by DCMU and HA. (d) Kinetics of P700 oxidation by light. (e) Kinetics of cyt oxidation by light. (f) Kinetics of oxidation of the entire pool of PSI electron donors by light. A cyt/PSI ratio of 3 was assumed based on the estimate shown in Supplementary Fig. 1. The light intensity was 800 μmol photons m−2 s−1. (cf) Solid blue squares: control; empty red circles: 40 μM DCMU; green triangles: 40 μM DCMU+2 mM HA. Means±s.e.m. (n=6, from three biological samples). F0: minimum fluorescence emission (active PSII). Fm: maximum fluorescence emission (inactive PSII). Closed box: actinic light off. Open box: actinic light on. DCMU and HA were added immediately before measurements.
Figure 2
Figure 2. Immunolocalization of photosystems and of cyt b6f in the thylakoid membranes of P. tricornutum.
(ac) TEM images of P. tricornutum labelled with antibodies directed against the PsaA subunit of PSI (a), the PsbA subunit of PSII (b) and the PetA subunit of cyt b6f (c). (d) TEM micrograph of P. tricornutum thylakoid membranes showing four distinct areas: the internal membranes (‘core’: violet); the external, peripheral membranes (‘per.’: green); the pyrenoid (‘pyr.’: orange) and the envelope (‘env.’: magenta). Bars: 200 nm. (e) Principal component analysis of PSI, cyt b6f and PSII immunolocalization with the PsbA (solid squares), PsbC (open squares), PetA (cyan circle), PsaC (solid triangles) and PsaA (open triangles) antibodies. See also Supplementary Fig. 4. A total of 258 images from four independent cultures were analysed. The first two components represent more than 91% of the variance (see Supplementary Table 1, and Methods for a more detailed explanation). Green arrow: peripheral variable; violet arrow: core variable; orange arrow: pyrenoid variable; Magenta arrow: envelope variable. (f) 2D representation of the barycentre for the PSI (α PsaA+α PsaC antibodies, black square), cyt b6f (PetA, cyan circle) and PSII (α PsbA+α PsbC antibodies, red triangle) distributions. The point size along an axis is proportional to the s.d. along the corresponding component. (g) Solubilization of P. tricornutum thylakoid membranes with increasing concentrations of digitonin (0.1%, 0.2%, 0.5%, 1%). Pellet (P) and supernatant (S) were analysed by western blotting with the same anti PSI, PSII and cyt b6f antibodies as in ac. Representative data set of an experiment replicated on three different biological samples.
Figure 3
Figure 3. Spectroscopic features of the cytochromes and P700 components of the electron transfer chain in P. tricornutum cells.
(ab) Redox kinetics of P700 (a) and cyt (b) at the offset of a steady state illumination of 800 μmol photons m−2 s−1 in the absence and in the presence of increasing concentrations of DCMU. Closed box: actinic light off. Open box: actinic light on. (c) Equilibrium plots displaying the percentage of oxidized cyt (from b) as a function of the percentage of oxidized P700 (from a). Every point in c represents a given time after the offset of light in a,b. The dotted lines represent simulations with different values of the equilibrium constant. The rate of electron transfer (calculated as described in Methods) was modified by addition of increasing concentrations of DCMU. (d) Fluorescence induction kinetics measured for every DCMU concentration employed in a,b. The decrease in variable fluorescence indicates the progressive inhibition of PSII by DCMU. Cells were exposed to 18 μmol photons m−2 s−1 because no variable fluorescence can be observed at 800 μmol photons m−2 s−1even in the absence of DCMU (see, for example, Fig. 1c). DCMU was added immediately before measurements. Blue square: control. Green circle: DCMU 30 nM. Wine upwards triangles: DCMU 100 nM. Red downwards triangles: DCMU 200 nM. Orange losange: DCMU 500 nM. Pink leftwards triangle: DCMU 10 μM. Blue dots: simulation with an equilibrium constant of 5. Green dash and dot line: simulation with an equilibrium constant of 10. Red continuous line: simulation with an equilibrium constant of 16. Black short dash dot line: simulation with an equilibrium constant of 30.
Figure 4
Figure 4. Three-dimensional organization of a P. tricornutum cell.
(a) Whole cell reconstruction of an intact P. tricornutum cell based on FIB-SEM images reveals the physical contacts between the chloroplast (green), mitochondrion (red) and nucleus (blue). (b) Chloroplast–mitochondria interaction. (c) Chloroplast–nucleus interaction. Images represent frames from Supplementary movie 1. Grey pictures in a, stacks of SEM micrographs; in b,c: selected single SEM frame. Coloured pictures in ac: 3D reconstruction. Yellow arrows highlight contacts between organelles. Bar: 400 nm.
Figure 5
Figure 5. Structural arrangement of the photosynthetic membranes in P. tricornutum.
(a) 3D image of a P. tricornutum plastid. Latitudinal (b) and longitudinal (c,d) sections reveal the 3D arrangement between the parallel photosynthetic membranes. Connections between the thylakoid layers (yellow circles) can be clearly differentiated from the plastoglobules (red circles), which appear as globular structures. (bd): Top: representative slices of the 3D reconstruction represented as grey-levels (darker is denser). (bd) Bottom: same areas as in top panels represented as two isosurfaces. The low density isosurface (green, thylakoid volume) and the high density isosurface (red, plastoglobules) are sliced by a semi-transparent plane (violet), to show the thylakoid stacks. Bars: 400 nm.

References

    1. Cavalier-Smith T. Genomic reduction and evolution of novel genetic membranes and protein-targeting machinery in eukaryote–eukaryote chimaeras (meta-algae). Philos. Trans. R. Soc. Lond. B Biol. Sci. 358, 109–133 (2003). - PMC - PubMed
    1. Dekker J. P. & Boekema E. J. Supramolecular organization of thylakoid membrane proteins in green plants. Biochim. Biophys. Acta 1706, 12–39 (2005). - PubMed
    1. Kirchhoff H., Schöttler M.-A., Maurer J. & Weis E. Plastocyanin redox kinetics in spinach chloroplasts: evidence for disequilibrium in the high potential chain. Biochim. Biophys. Acta 1659, 63–72 (2004). - PubMed
    1. Kirchhoff H. et al.. Dynamic control of protein diffusion within the granal thylakoid lumen. Proc. Natl Acad. Sci. USA 108, 20248–20253 (2011). - PMC - PubMed
    1. Bedoshvili Y. D., Popkova T. P. & Likhoshway Y. V. Chloroplast structure of diatoms of different classes. Cell Tissue Biol. 3, 297–310 (2009).

Publication types

MeSH terms

Substances