. 2017 Nov;95(11):2244-2252.
doi: 10.1002/jnr.24103. Epub 2017 Jun 20.

Mild metabolic perturbations alter succinylation of mitochondrial proteins

Affiliations

Mild metabolic perturbations alter succinylation of mitochondrial proteins

Huanlian Chen et al. J Neurosci Res. 2017 Nov.

Abstract

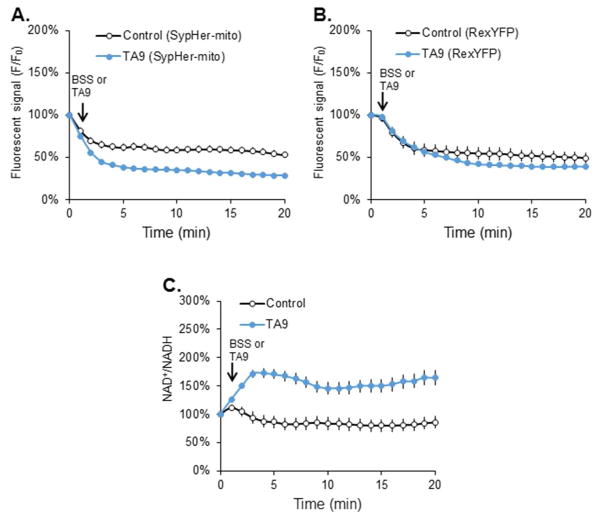
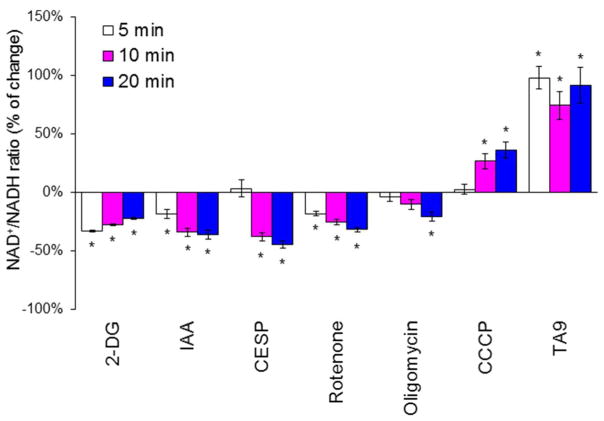
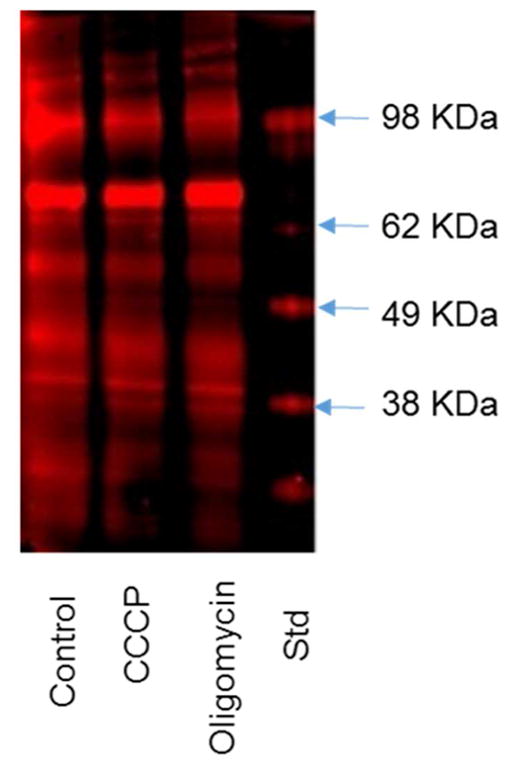
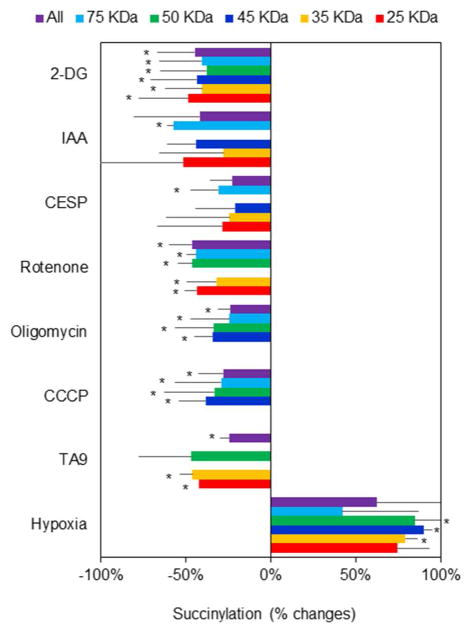
Succinylation of proteins is widespread, modifies both the charge and size of the molecules, and can alter their function. For example, liver mitochondrial proteins have 1,190 unique succinylation sites representing multiple metabolic pathways. Succinylation is sensitive to both increases and decreases of the NAD+ -dependent desuccinylase, SIRT5. Although the succinyl group for succinylation is derived from metabolism, the effects of systematic variation of metabolism on mitochondrial succinylation are not known. Changes in succinylation of mitochondrial proteins following variations in metabolism were compared against the mitochondrial redox state as estimated by the mitochondrial NAD+ /NADH ratio using fluorescent probes. The ratio was decreased by reduced glycolysis and/or glutathione depletion (iodoacetic acid; 2-deoxyglucose), depressed tricarboxylic acid cycle activity (carboxyethyl ester of succinyl phosphonate), and impairment of electron transport (antimycin) or ATP synthase (oligomycin), while uncouplers of oxidative phosphorylation (carbonyl cyanide m-chlorophenyl hydrazine or tyrphostin) increased the NAD+ /NADH ratio. All of the conditions decreased succinylation. In contrast, reducing the oxygen from 20% to 2.4% increased succinylation. The results demonstrate that succinylation varies with metabolic states, is not correlated to the mitochondrial NAD+ /NADH ratio, and may help coordinate the response to metabolic challenge.

Keywords: electron transport chain; glucose; hypoxia; succinylation; α-ketoglutarate dehydrogenase.


Figures

Figure 1
Figure 1
Mitochondrial localization of RexYFP-mito and SypHer-mito in N2a cells. Mitochondrial localization of the NADH probe and mitochondrial pH probe in N2a cells. N2a cells were cultured on the Delta TPG dishes at a seeding density of 5× 10⁴ cells/dish. The next day, cells were transfected with RexYFP-mito (1A) or SypHer-mito (1B) for 48 hr at 37°C. After transfection, the cells were loaded with MitoTracker Red (1 μM) for 30 min at 37°C. After loading, cells were rinsed with BSS buffer and the fluorescent signals were acquired by a confocal laser scanning microscopy with a plan-neofluor 40×/1.3 objective (488 nm excitation; 505–550 emission) (see Methods).
Figure 2
Figure 2
The temporal response of RexYFP-mito, SypHer-mito and the NAD+/NADH ratio to the uncoupler TA9. (A) Fluorescent signal (F/F0) of SypHer-mito after TA9. N2a cells were transfected with SypHer-mito (2 μg) for 48 hr at 37°C. After transfection, the cells were treated with TA9 (5 μM) for 20 min. (B) Fluorescent signal (F/F0) of RexYFP-mito after TA9. N2a cells were transfected with RexYFP-mito (2 μg) for 48 hr at 37°C. After transfection, the cells were treated with TA9 (5 μM) for 20 min. (C) NAD+/NADH ratios after TA9 treatment. NAD+/NADH ratio were calculated by normalizing the F/F0 of RexYFP-mito to the F/F0 of the SypHer-mito. Values are the means ± S.E.M. of the NAD+/NADH ratio at different time points compared with basal NAD+/NADH level from two independent experiments (total 328 cells, 153 cells from 5 dishes in control and 172 cells from 6 dishes in treatment group)
Figure 3
Figure 3
Metabolic manipulation alters the mitochondrial NAD+/NADH ratio in N2a cells. N2a cells were cultured on the Delta TPG dishes at a seeding density of 5 × 10⁴ cells/dish. The next day, cells were transfected with RexYFP-mito (2 μg) or SypHer-mito (2 μg) for 48 hr at 37°C. After transfection, the cells were rinsed with BSS buffer and the fluorescent signals were acquired with a confocal laser scanning microscope with a plan-neofluar 40×/1.3 objective (488 nm excitation; 505–550 emission). In the following sentences n refers to the number of cells that were analyzed from 3 to 4 experiments. After 1 min of basal signal, 2-DG (15 mM; n=115), IAA (5 μM; n=81), rotenone (5 μM; n=54), oligomycin (10 μM; n=80), CCCP (5 μM; n=100), TA9 (5 μM; n=66), or CESP (100 μM; n=80) were added directly into the dishes and the signals were acquired for 5, 10 and 20 min. Values are the means ± S.E.M. of the NAD+/NADH ratio % changes compared with control group. *Values vary significantly (p<0.05) from control by ANOVA followed by the Student Newman-Keuls test.
Figure 4
Figure 4
Diminished succinylation following treatment with CCCP or oligomycin. N2a cells were seeded on the 10 cm dishes at the density of 8 × 10⁶ cells/dish and cultured for two days. After two day of culture, the cells were treated with CCCP (5μM) or Oligomycin (10 μM) in BSS buffer for 20 min at 37°C. After treatment, the mitochondrial fractions were isolated and immnuoprecipitated with Pan anti-succinyllysine antibody overnight at 4°C and separated by Western blot.
Figure 5
Figure 5
The effects of various metabolic perturbations on succinylation. Conditions for each manipulation were exactly as for determining the NAD+/NADH ratios. N2a cells were seeded on the 10 cm dishes at the density of 8 × 10⁶ cells/dish and cultured for two days. After two days of culture, the cells were treated with 2-DG (15 mM), IAA (5 μM), CESP (100 μM), Rotenone (5 μM), Oligomycin (10 μM), CCCP (5 μM), TA9 (5 μM) for 20 min at 37°C. For the hypoxia experiments, cells were incubated with hypoxia (2.4% O2) for 1 hour at 37°C. The mitochondrial fractions from different treatments were isolated and immnuoprecipitated with Pan anti-succinyllysine antibody overnight at 4°C and separated by Western blot. Each band reflects succinylation of many proteins so the results are quite variable. Data were the changes of succinylation compared with control group from different bands of protein expression after rejecting the outliers with Q-test. *Values vary significantly (p<0.05) from control by ANOVA followed by the Tukey test. df (degree of freedom) and F values in each groups are shown in the following table. [Table: see text]

References

    1. Ambrose-Griffin MC, Danson MJ, Griffin WG, Hale G, Perham RN. Kinetic analysis of the role of lipoic acid residues in the pyruvate dehydrogenase multienzyme complex of Escherichia coli. Biochemical Journal. 1980;187(2):393–401. - PMC - PubMed
    1. Barbi de Moura M, Uppala R, Zhang Y, Van Houten B, Goetzman ES. Overexpression of Mitochondrial Sirtuins Alters Glycolysis and Mitochondrial Function in HEK293 Cells. PLOS ONE. 2014;9(8):e106028. - PMC - PubMed
    1. Bilan DS, Matlashov ME, Gorokhovatsky AY, Schultz C, Enikolopov G, Belousov VV. Genetically encoded fluorescent indicator for imaging NAD+/NADH ratio changes in different cellular compartments. Biochimica et Biophysica Acta (BBA) - General Subjects. 2014;1840(3):951–957. - PMC - PubMed
    1. Bunik VI, Denton TT, Xu H, Thompson CM, Cooper AJL, Gibson GE. Phosphonate Analogues of α-Ketoglutarate Inhibit the Activity of the α-Ketoglutarate Dehydrogenase Complex Isolated from Brain and in Cultured Cells. Biochemistry. 2005;44(31):10552–10561. - PubMed
    1. Choudhary C, Weinert BT, Nishida Y, Verdin E, Mann M. The growing landscape of lysine acetylation links metabolism and cell signalling. Nat Rev Mol Cell Biol. 2014;15(8):536–550. - PubMed

Publication types

LinkOut - more resources