

Combined assessment of DYRK1A, BDNF and homocysteine levels as diagnostic marker for Alzheimer's disease
- PMID: 28632203
- PMCID: PMC5537644
- DOI: 10.1038/tp.2017.123
Combined assessment of DYRK1A, BDNF and homocysteine levels as diagnostic marker for Alzheimer's disease
Abstract
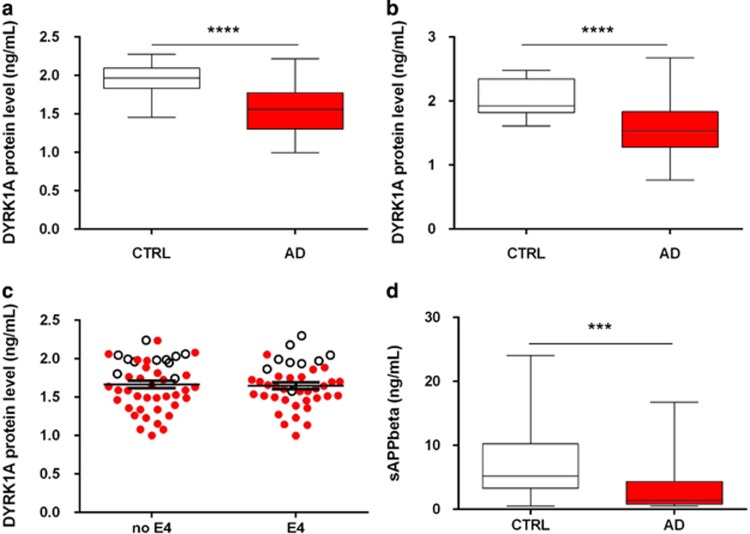
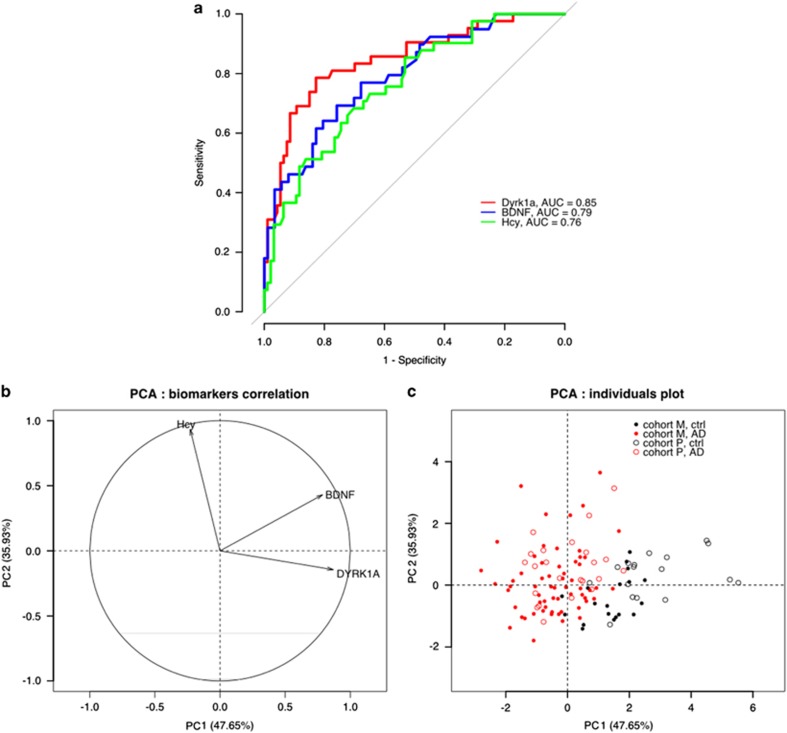
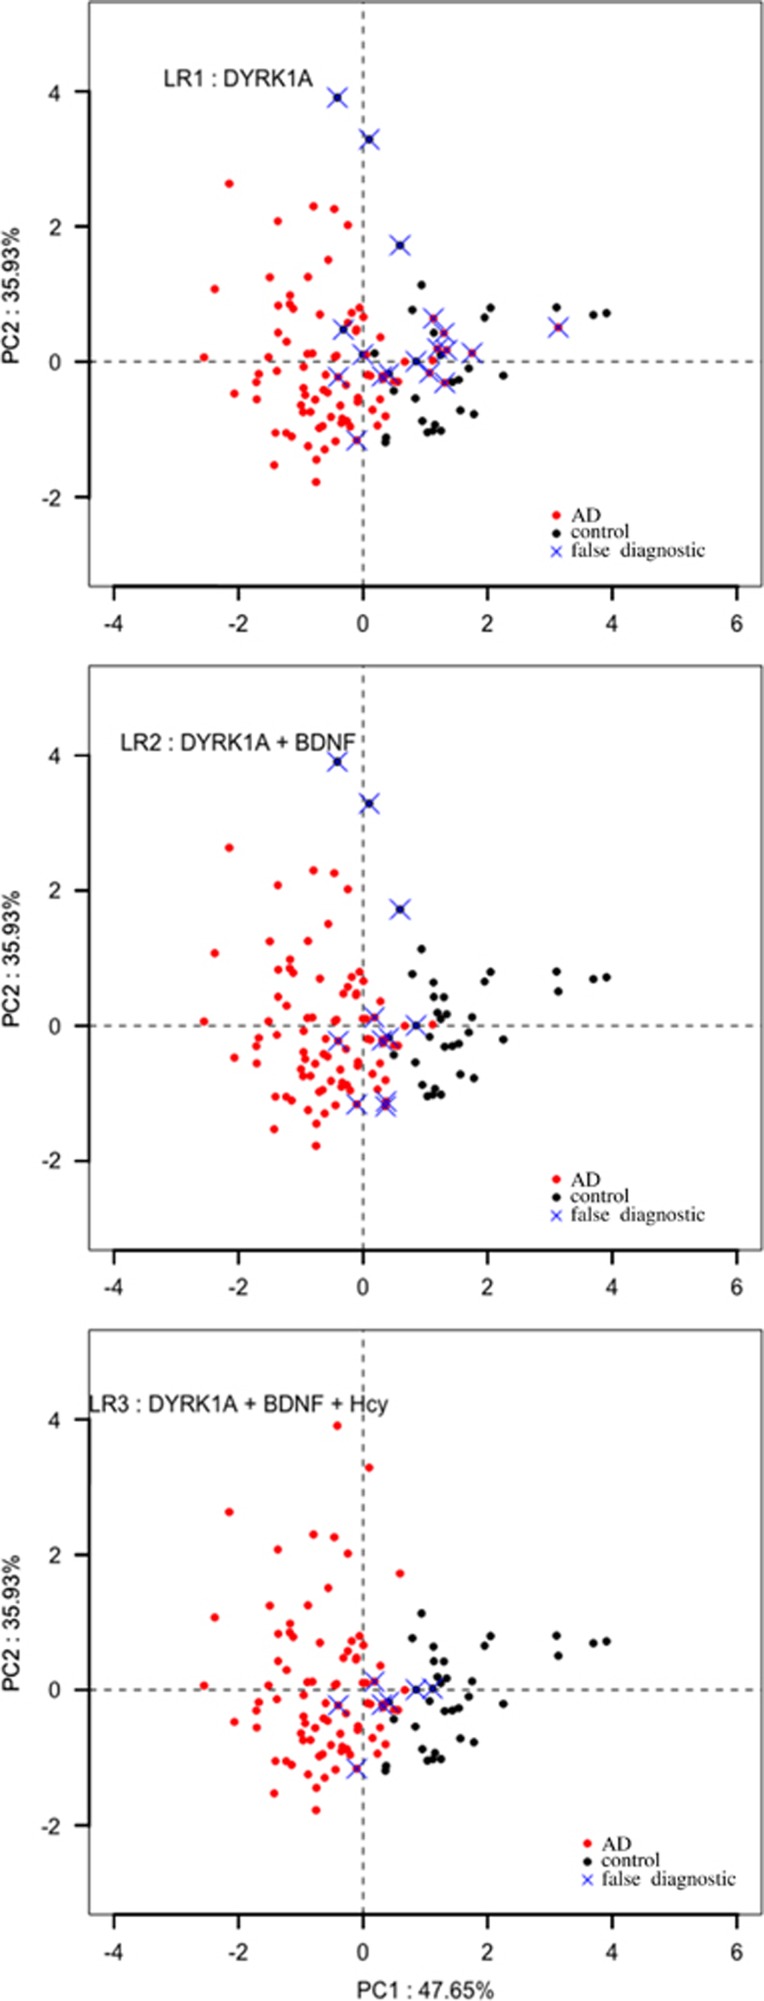
Early identification of Alzheimer's disease (AD) risk factors would aid development of interventions to delay the onset of dementia, but current biomarkers are invasive and/or costly to assess. Validated plasma biomarkers would circumvent these challenges. We previously identified the kinase DYRK1A in plasma. To validate DYRK1A as a biomarker for AD diagnosis, we assessed the levels of DYRK1A and the related markers brain-derived neurotrophic factor (BDNF) and homocysteine in two unrelated AD patient cohorts with age-matched controls. Receiver-operating characteristic curves and logistic regression analyses showed that combined assessment of DYRK1A, BDNF and homocysteine has a sensitivity of 0.952, a specificity of 0.889 and an accuracy of 0.933 in testing for AD. The blood levels of these markers provide a diagnosis assessment profile. Combined assessment of these three markers outperforms most of the previous markers and could become a useful substitute to the current panel of AD biomarkers. These results associate a decreased level of DYRK1A with AD and challenge the use of DYRK1A inhibitors in peripheral tissues as treatment. These measures will be useful for diagnosis purposes.
Conflict of interest statement
The authors declare no conflict of interest.
Figures

Similar articles
-
Plasma DYRK1A as a novel risk factor for Alzheimer's disease.Transl Psychiatry. 2014 Aug 12;4(8):e425. doi: 10.1038/tp.2014.61. Transl Psychiatry. 2014. PMID: 25116835 Free PMC article.
-
Abnormalities of DYRK1A-Cytoskeleton Complexes in the Blood Cells as Potential Biomarkers of Alzheimer's Disease.J Alzheimers Dis. 2019;72(4):1059-1075. doi: 10.3233/JAD-190475. J Alzheimers Dis. 2019. PMID: 31683476 Free PMC article.
-
Conversion from MCI to AD in patients with the APOE ε4 genotype: Prediction by plasma HCY and serum BDNF.Neurosci Lett. 2016 Jul 28;626:19-24. doi: 10.1016/j.neulet.2016.05.018. Epub 2016 May 11. Neurosci Lett. 2016. PMID: 27180036
-
[Elucidating Pathogenic Mechanisms of Early-onset Alzheimer's Disease in Down Syndrome Patients].Yakugaku Zasshi. 2017;137(7):801-805. doi: 10.1248/yakushi.16-00236-2. Yakugaku Zasshi. 2017. PMID: 28674290 Review. Japanese.
-
Postmortem Brain, Cerebrospinal Fluid, and Blood Neurotrophic Factor Levels in Alzheimer's Disease: A Systematic Review and Meta-Analysis.J Mol Neurosci. 2018 Jul;65(3):289-300. doi: 10.1007/s12031-018-1100-8. Epub 2018 Jun 28. J Mol Neurosci. 2018. PMID: 29956088
Cited by
-
Blood and CSF Homocysteine Levels in Alzheimer's Disease: A Meta-Analysis and Meta-Regression of Case-Control Studies.Neuropsychiatr Dis Treat. 2022 Oct 17;18:2391-2403. doi: 10.2147/NDT.S383654. eCollection 2022. Neuropsychiatr Dis Treat. 2022. PMID: 36276430 Free PMC article. Review.
-
Deciphering the Link Between Hyperhomocysteinemia and Ceramide Metabolism in Alzheimer-Type Neurodegeneration.Front Neurol. 2019 Jul 31;10:807. doi: 10.3389/fneur.2019.00807. eCollection 2019. Front Neurol. 2019. PMID: 31417486 Free PMC article.
-
Hypothesis and Theory: Circulating Alzheimer's-Related Biomarkers in Type 2 Diabetes. Insight From the Goto-Kakizaki Rat.Front Neurol. 2019 Jun 26;10:649. doi: 10.3389/fneur.2019.00649. eCollection 2019. Front Neurol. 2019. PMID: 31293498 Free PMC article.
-
Dual-Specificity, Tyrosine Phosphorylation-Regulated Kinases (DYRKs) and cdc2-Like Kinases (CLKs) in Human Disease, an Overview.Int J Mol Sci. 2021 Jun 3;22(11):6047. doi: 10.3390/ijms22116047. Int J Mol Sci. 2021. PMID: 34205123 Free PMC article. Review.
-
Homocysteine-lowering gene therapy rescues signaling pathways in brain of mice with intermediate hyperhomocysteinemia.Redox Biol. 2018 Oct;19:200-209. doi: 10.1016/j.redox.2018.08.015. Epub 2018 Aug 25. Redox Biol. 2018. PMID: 30172984 Free PMC article.
References
-
- Ballard C, Gauthier S, Corbett A, Brayne C, Aarsland D, Jones E. Alzheimer's disease. Lancet 2011; 377: 1019–1031. - PubMed
-
- Souchet B, Guedj F, Sahun I, Duchon A, Daubigney F, Badel A et al. Excitation/inhibition balance and learning are modified by Dyrk1a gene dosage. Neurobiol Dis 2014; 69: 65–75. - PubMed
-
- Hamelet J, Noll C, Ripoll C, Paul JL, Janel N, Delabar JM. Effect of hyperhomocysteinemia on the protein kinase DYRK1A in liver of mice. Biochem Biophys Res Commun 2009; 378: 673–677. - PubMed
MeSH terms
Substances
LinkOut - more resources
Full Text Sources
Other Literature Sources
Medical
