

Changing US Population Demographics: What Does This Mean for Listeriosis Incidence and Exposure?
- PMID: 28632414
- PMCID: PMC5646752
- DOI: 10.1089/fpd.2017.2297
Changing US Population Demographics: What Does This Mean for Listeriosis Incidence and Exposure?
Abstract
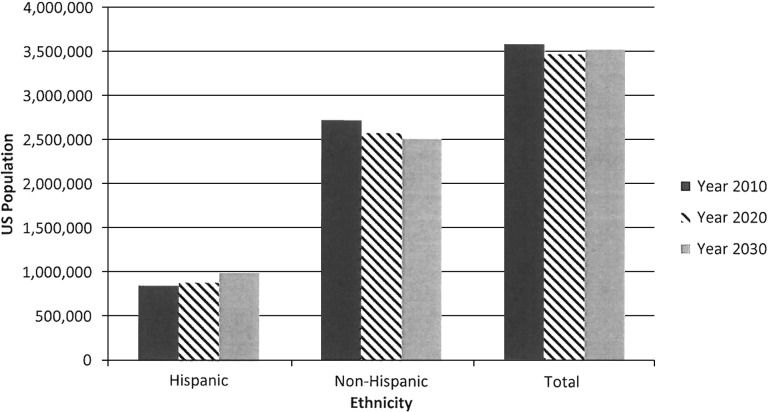
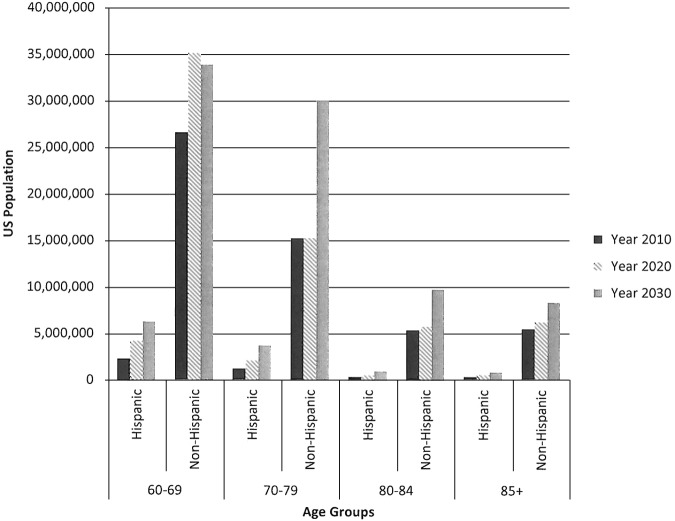
Listeria monocytogenes is an important cause of foodborne illness hospitalization, fetal loss, and death in the United States. Listeriosis incidence rate varies significantly among population subgroups with pregnant women, older persons, and the Hispanic population having increased relative risks compared with the other subpopulations. Using estimated rates of listeriosis per subpopulation based on FoodNet data from 2004 to 2009, we evaluate the expected number of cases and incidence rates of listeriosis in the US population and the pregnant women subpopulation as the demographic composition changes over time with respect to ethnicity, pregnancy status, and age distribution. If the incidence rate per subpopulation is held constant, the overall US population listeriosis incidence rate would increase from 0.25 per 100,000 (95% confidence interval [CI]: 0.19-0.34) in 2010 to 0.28 (95% CI: 0.22-0.38) in 2020 and 0.32 (95% CI: 0.25-0.43) in 2030, because of the changes in the population structure. Similarly, the pregnancy-associated incidence rate is expected to increase from 4.0 per 100,000 pregnant women (95% CI: 2.5-6.5) in 2010 to 4.1 (95% CI: 2.6-6.7) in 2020 and 4.4 (95% CI: 2.7-7.2) in 2030 as the proportion of Hispanic pregnant women increases. We further estimate that a reduction of 12% in the exposure of the US population to L. monocytogenes would be needed to maintain a constant incidence rate from 2010 to 2020 (current trend), assuming infectivity (strain virulence distribution and individual susceptibility) is unchanged. To reduce the overall US population incidence rate by one-third (Healthy People 2020 goal) would require a reduction in exposure (or infectivity) to L. monocytogenes of 48% over the same time period. Reduction/elimination in exposure of pregnant and Hispanic subpopulations alone could not meet this target. This information may be useful in setting public health targets, developing risk management options, and in interpreting trends in the public health burden of foodborne listeriosis in the United States.
Keywords: Hispanic; Listeria monocytogenes; US population; demographics; elderly; pregnant.
Conflict of interest statement
No competing financial interests exist.
Figures

References
-
- Bates D, Mächler M, Bolker B, Walker S. Fitting linear mixed-effects models using lme4. J Stat Softw 2015;67:1–48
-
- Census Bureau. 2009 national population projections (supplemental). Population Projections. 2009. Available at: http://www.census.gov/population/projections/data/national/2009.html Accessed October17, 2016
-
- Census Bureau. 2014 national population projections. Population Projections. 2014. Available at: http://www.census.gov/population/projections/data/national/2014.html Accessed October17, 2016
-
- Crim SM, Iwamoto M, Huang JY, Griffin PM, Gilliss D, Cronquist AB, Cartter M, Tobin-D'Angelo M, Blythe D, Smith K, Lathrop S, Zansky S, Cieslak PR, Dunn J, Holt KG, Lance S, Tauxe R, Henao OL. Incidence and trends of infection with pathogens transmitted commonly through food—Foodborne diseases active surveillance network, 10 us sites, 2006–2013. MMWR Morb Mortal Wkly Rep 2014;63:328–332 - PMC - PubMed
MeSH terms
LinkOut - more resources
Full Text Sources
Other Literature Sources
Medical