. 2017 Jun 1;9(6):1658-1672.
doi: 10.1093/gbe/evx110.

Genetic Indicators of Drug Resistance in the Highly Repetitive Genome of Trichomonas vaginalis

Affiliations

Genetic Indicators of Drug Resistance in the Highly Repetitive Genome of Trichomonas vaginalis

Martina Bradic et al. Genome Biol Evol. .

Abstract

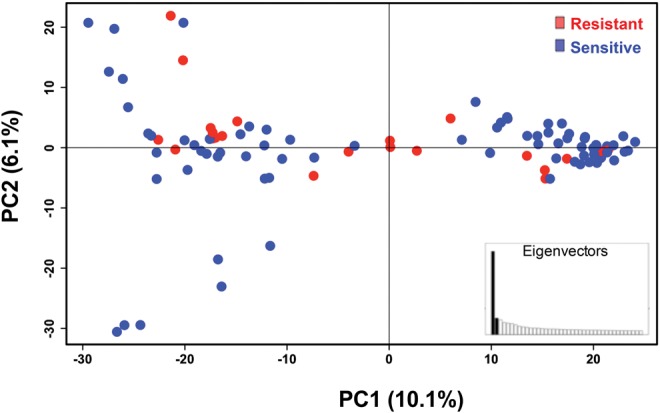
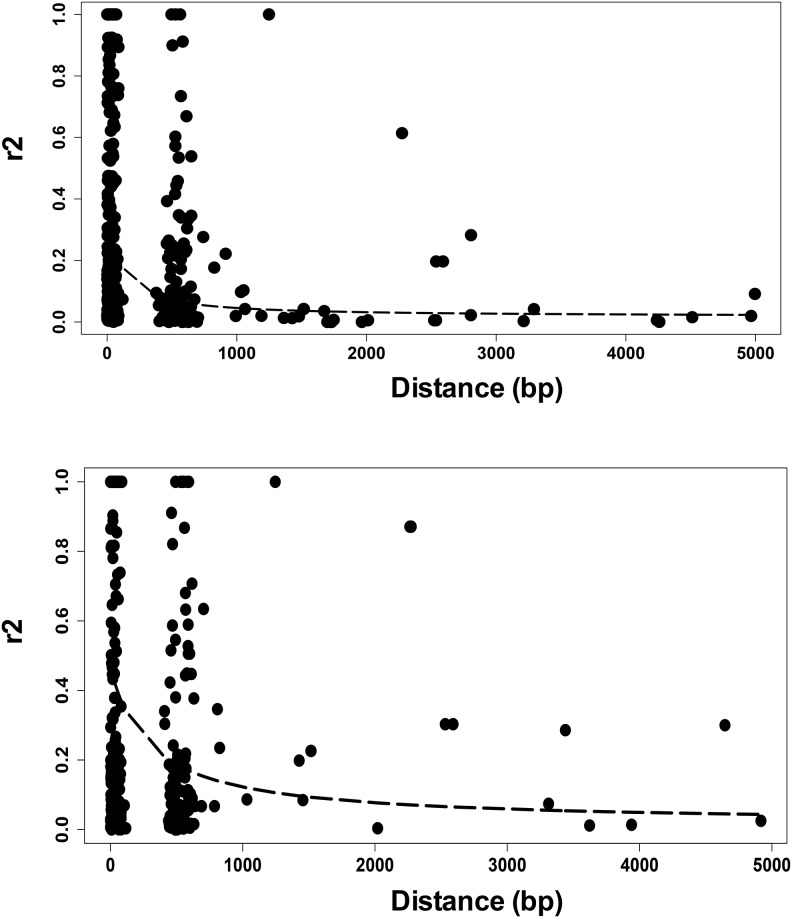
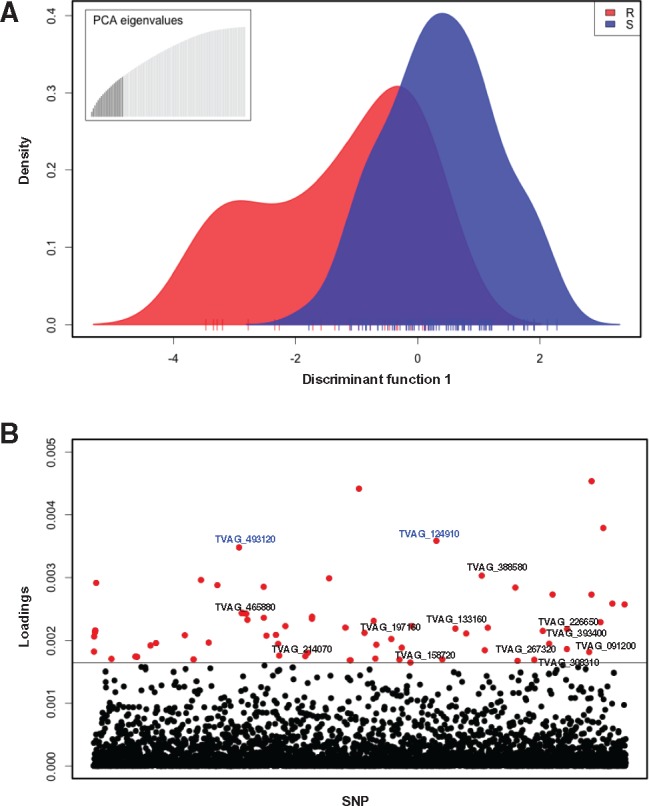
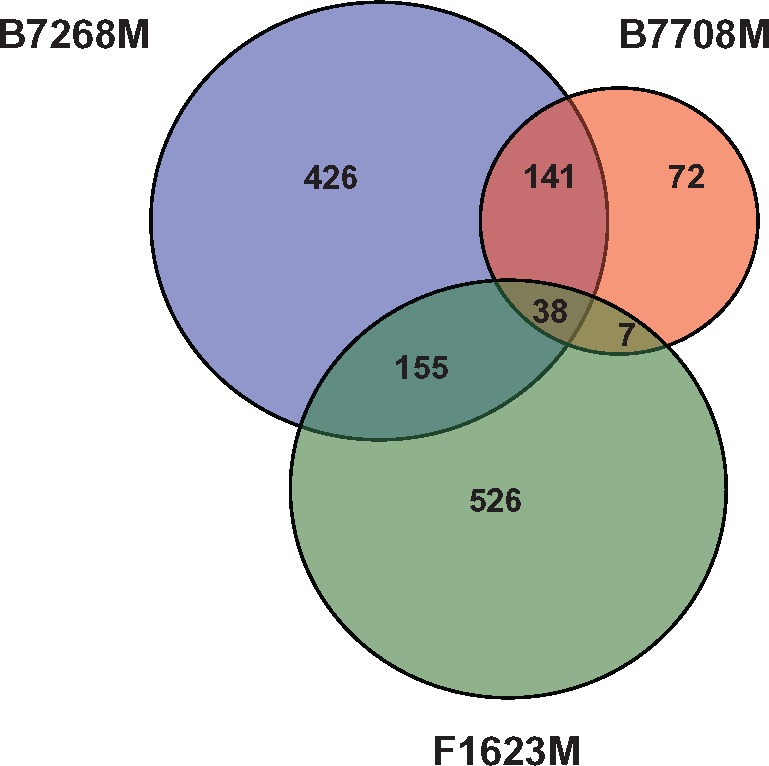
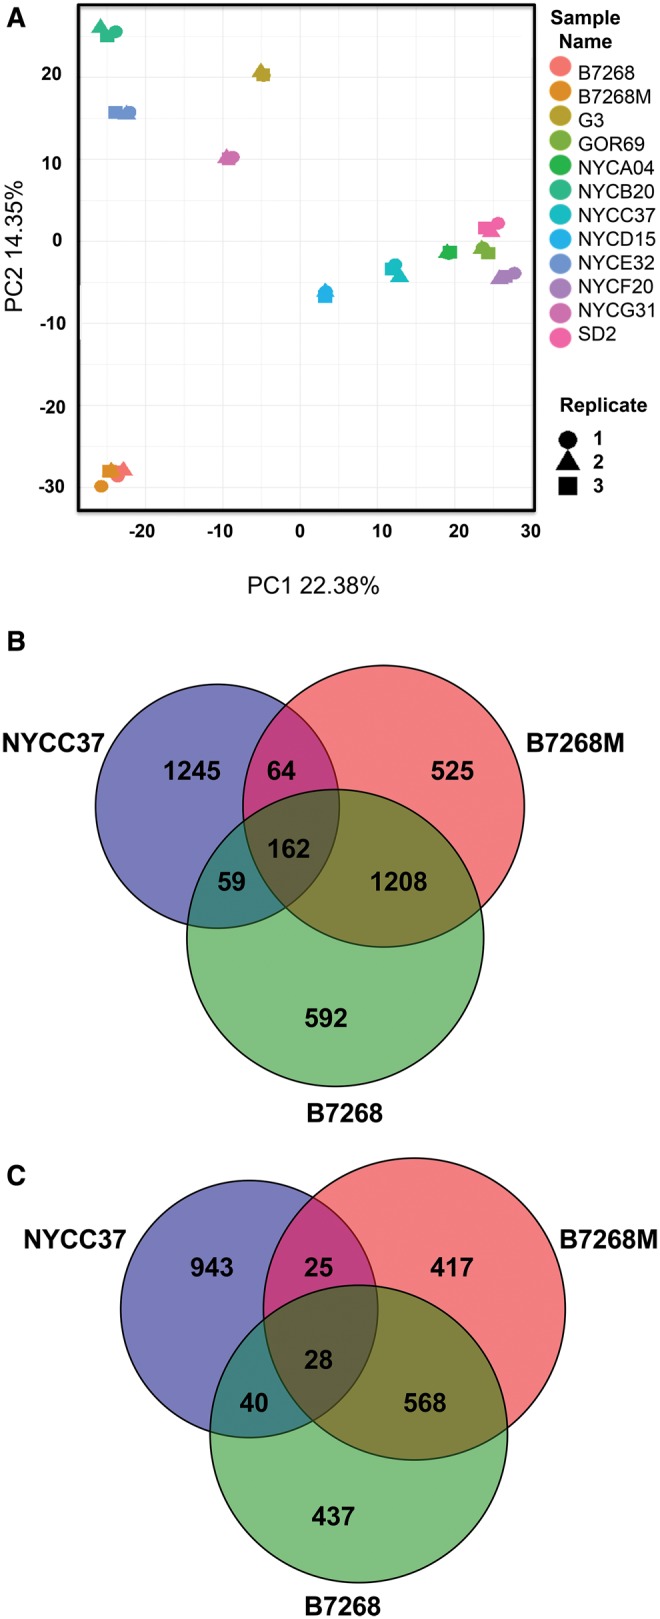
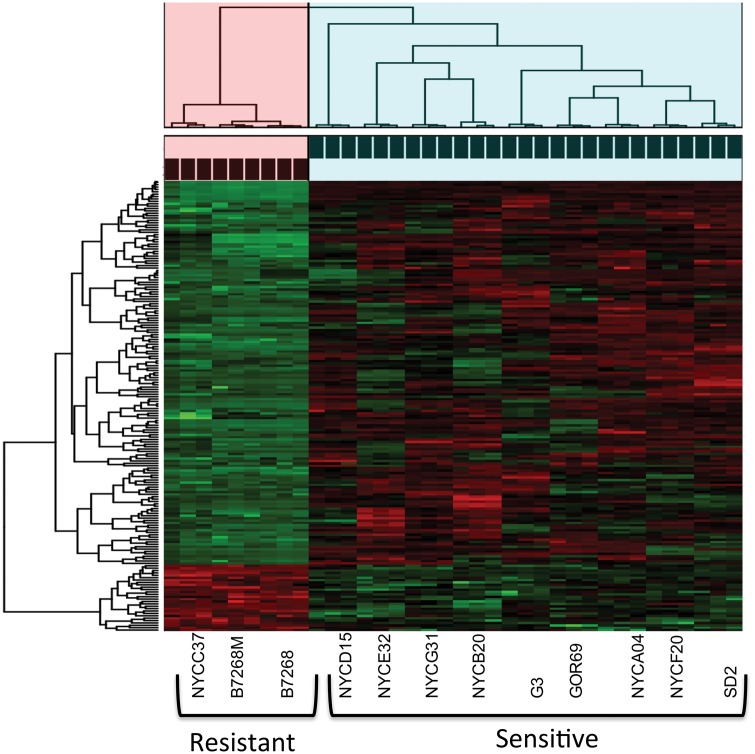
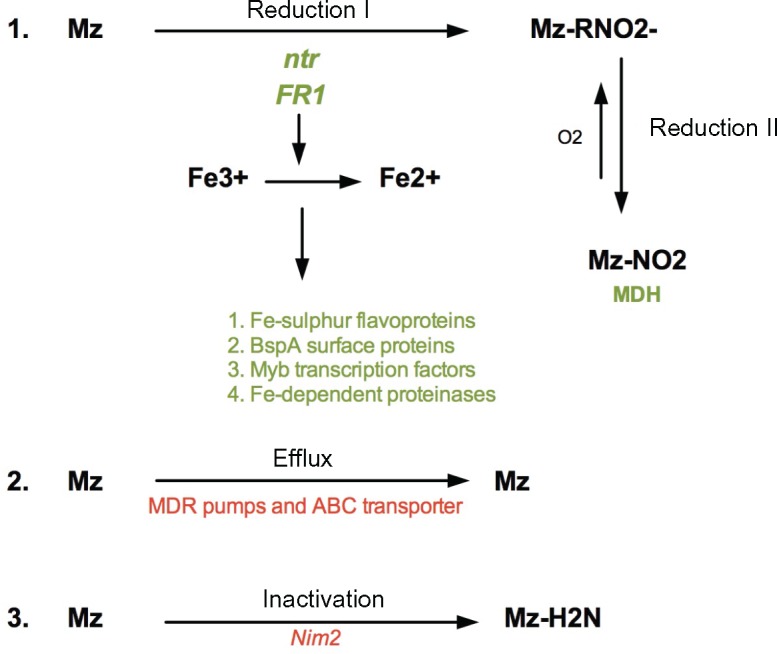
Trichomonas vaginalis, the most common nonviral sexually transmitted parasite, causes ∼283 million trichomoniasis infections annually and is associated with pregnancy complications and increased risk of HIV-1 acquisition. The antimicrobial drug metronidazole is used for treatment, but in a fraction of clinical cases, the parasites can become resistant to this drug. We undertook sequencing of multiple clinical isolates and lab derived lines to identify genetic markers and mechanisms of metronidazole resistance. Reduced representation genome sequencing of ∼100 T. vaginalis clinical isolates identified 3,923 SNP markers and presence of a bipartite population structure. Linkage disequilibrium was found to decay rapidly, suggesting genome-wide recombination and the feasibility of genetic association studies in the parasite. We identified 72 SNPs associated with metronidazole resistance, and a comparison of SNPs within several lab-derived resistant lines revealed an overlap with the clinically resistant isolates. We identified SNPs in genes for which no function has yet been assigned, as well as in functionally-characterized genes relevant to drug resistance (e.g., pyruvate:ferredoxin oxidoreductase). Transcription profiles of resistant strains showed common changes in genes involved in drug activation (e.g., flavin reductase), accumulation (e.g., multidrug resistance pump), and detoxification (e.g., nitroreductase). Finally, we identified convergent genetic changes in lab-derived resistant lines of Tritrichomonas foetus, a distantly related species that causes venereal disease in cattle. Shared genetic changes within and between T. vaginalis and Tr. foetus parasites suggest conservation of the pathways through which adaptation has occurred. These findings extend our knowledge of drug resistance in the parasite, providing a panel of markers that can be used as a diagnostic tool.

Keywords: Trichomonas vaginalis; antimicrobial drug resistance; comparative genomics; genetic association study; sexually transmitted infection.


Figures

<sc>Fig</sc>. 1.
Fig. 1.
—Population structure in T. vaginalis global samples. Principal components analysis of 102 T. vaginalis isolates using 3,923 genome-wide ddRAD SNPs. The x-axis represents principal component one (PC1) and explains 10.1% of the variation, while the y-axis represents principle component two (PC2), and explains 6.1% of the variation; the inset represents distribution of eigenvalues where each eigenvalue is the variance of the corresponding PC. Colors show variation in 32 Mz resistant (red) and 63 Mz sensitive (blue) isolates as defined by MLC ≥ 100 μg/mL. Individual isolate assignment to each sub-population cluster is summarized in supplementary table S2, Supplementary Material online.
<sc>Fig</sc>. 2.
Fig. 2.
—LD decays over distance in two populations of T. vaginalis. LD decay calculated over 5 kb intervals in 898 contigs (top panel) and 872 contigs (bottom panel) is shown for the two populations of T. vaginalis.
<sc>Fig</sc>. 3.
Fig. 3.
—Association mapping for Mz resistance in T. vaginalis. (A) Discriminant analysis of principal components (DAPC) representing variation and distribution of markers between drug resistant (red) and drug sensitive (blue) isolates. Ticks on the x-axis represent individual isolates. The inset represents the distribution of eigenvalues, with the black histogram showing all the principle components that were used in the DAPC analysis. (B) Loadings plot of the SNPs used for association analysis. The distribution of variances for SNP markers within and between resistant and sensitive isolates is represented as a loading value for each marker. The loading values above the threshold represent the largest between-group variance and the smallest within-group variance and are associated with the resistant phenotype. SNP markers are indicated on the x-axis, and the loadings value for each SNP on the y-axis; a horizontal line indicates the loadings threshold. Red dots represent 72 SNPs identified as significantly contributing to Mz resistance. Text in blue font represents two nonsynonymous SNPs in two conserved hypothetical genes (TVAG_493120 and TVAG_124910) common to both moderate (MLC ≥ 100) and high (MLC ≥ 400 Mz) phenotypes.
<sc>Fig</sc>. 4.
Fig. 4.
—Common genetic changes in laboratory-derived T. vaginalis lines. Venn diagram circle sizes are based on numbers of genes that have nonsynonymous SNPs. A nonsynonymous SNP was defined as a position where the nucleotide in the ancestral strain was the same as in the reference G3 strain, but different in the derived (more resistant) strain.
<sc>Fig</sc>. 5.
Fig. 5.
—Differential gene expression in laboratory-derived and clinically resistant T. vaginalis versus sensitive lines. (A) Principal components analysis of 12 isolates and their replicates based on normalized gene read counts. Replicates are indicated as shapes and different isolates as colors. (B) Venn diagram of number of genes in three Mz-resistant strains whose expression is upregulated in comparison with nine Mz-sensitive strains. (C) Venn diagram of number of genes in the same strains whose expression is downregulated in comparison with nine Mz-sensitive strains. Changes in genes where difference in gene expression is significant to P < 0.001 are shown. All the circles are sized based on marker numbers.
<sc>Fig</sc>. 6.
Fig. 6.
—Heatmap and cluster analysis of the association between gene expression and Mz resistance phenotype for commonly up- and down-regulated genes in T. vaginalis. Heatmap is constructed on normalized gene read counts. Cluster analysis and chi-square analysis were performed on genes that had significant expression changes in each resistant strain in comparison to sensitive strains. Drug resistance strains significantly clustered together based on their gene expression profile for 162 downregulated and 28 upregulated genes (chi-square test, P = 2.76e-08). Green color represents downregulated genes, red color represent upregulated genes in resistant strains. Pink cluster represent three resistant strains (Resistant cluster = 9 samples), while blue cluster represents nine sensitive strains (Sensitive cluster = 27 samples) corresponding.
<sc>Fig</sc>. 7.
Fig. 7.
—Summary and proposed model of Mz resistance as three major processes: (1) Drug reduction, (2) Drug Efflux, and (3) Drug inactivation. Red color represents upregulated genes, green color represents downregulated genes.

References

    1. Anders S, Pyl PT, Huber W.. 2015. HTSeq—a Python framework to work with high-throughput sequencing data. Bioinformatics 31:166–169. - PMC - PubMed
    1. Ansell BR, et al. 2017. Transcriptomics indicates active and passive metronidazole resistance mechanisms in three seminal giardia lines. Front Microbiol. 8:398. - PMC - PubMed
    1. Arroyo R, et al. 2015. Trichomonas vaginalis cysteine proteinases: iron response in gene expression and proteolytic activity. Biomed Res Int. 2015:946787. - PMC - PubMed
    1. Aurrecoechea C, et al. 2009. GiardiaDB and TrichDB: integrated genomic resources for the eukaryotic protist pathogens Giardia lamblia and Trichomonas vaginalis. Nucleic Acids Res. 37:D526–D530. - PMC - PubMed
    1. Barratt J, Gough R, Stark D, Ellis J.. 2016. Bulky trichomonad genomes: encoding a Swiss Army knife. Trends Parasitol. 32:783–797. - PubMed

Publication types