. 2017 Oct;31(10):4305-4324.
doi: 10.1096/fj.201700097R. Epub 2017 Jun 20.

Prolonged darkness reduces liver fibrosis in a mouse model of primary sclerosing cholangitis by miR-200b down-regulation

Affiliations

Prolonged darkness reduces liver fibrosis in a mouse model of primary sclerosing cholangitis by miR-200b down-regulation

Nan Wu et al. FASEB J. 2017 Oct.

Abstract

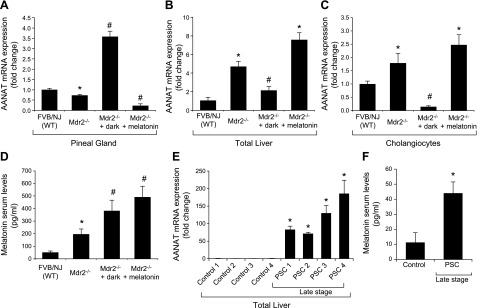
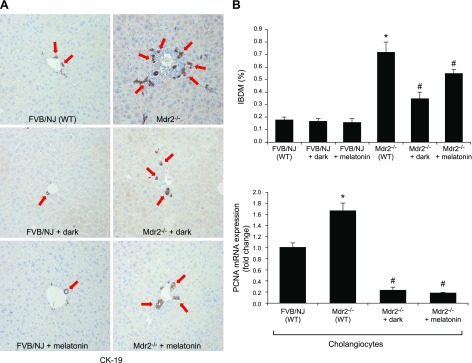
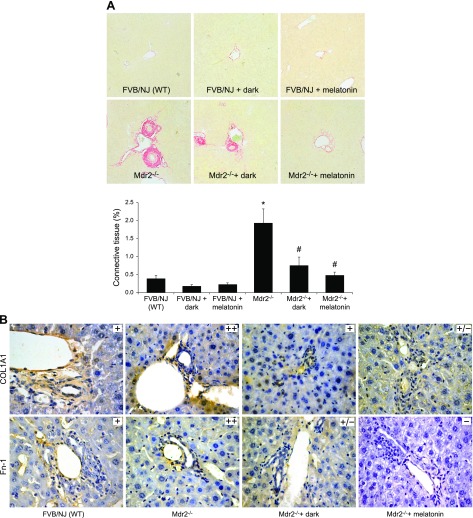
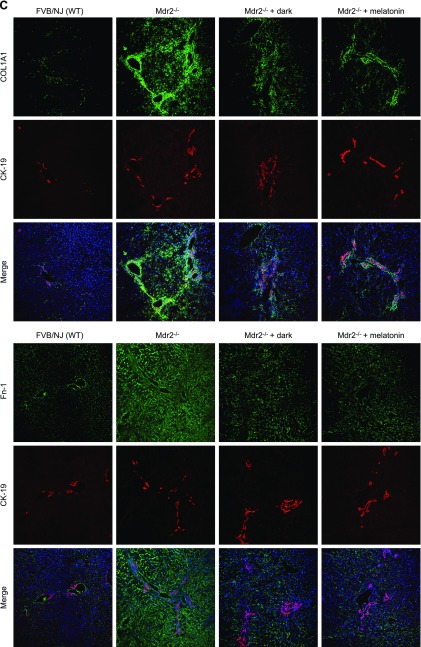
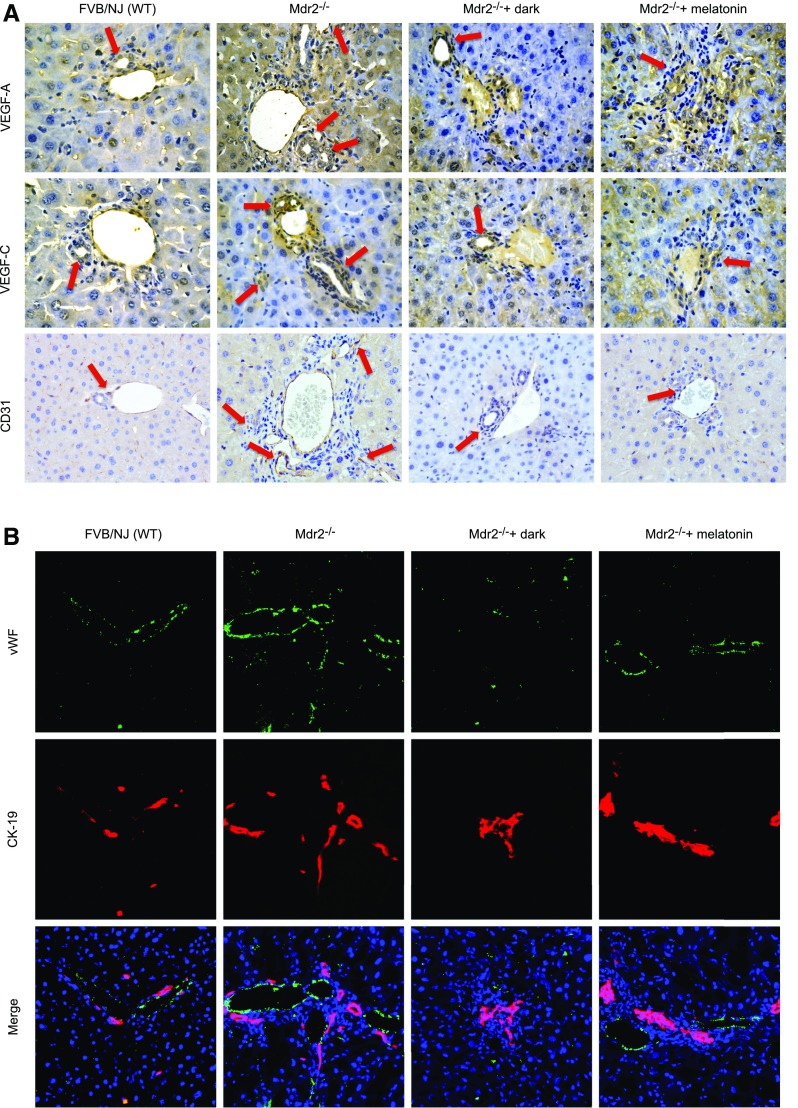
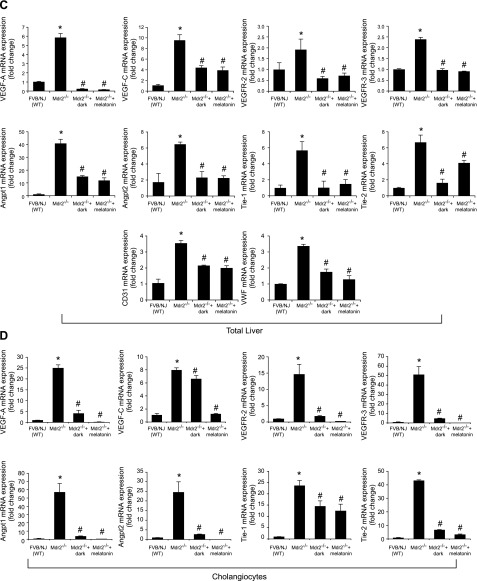
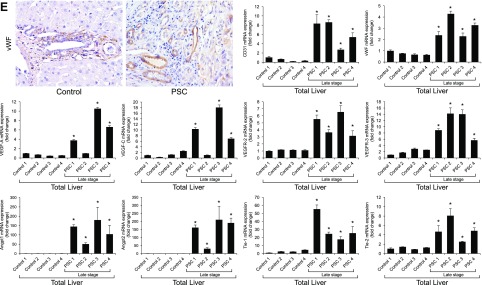
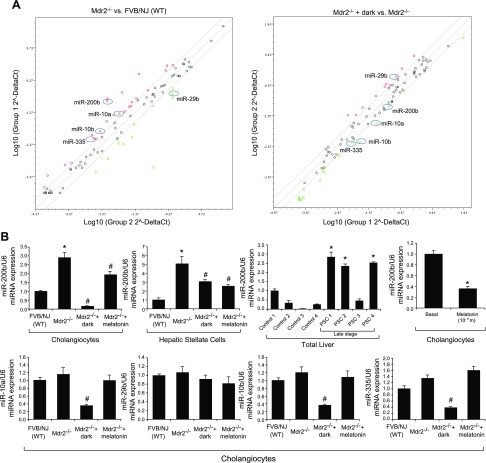
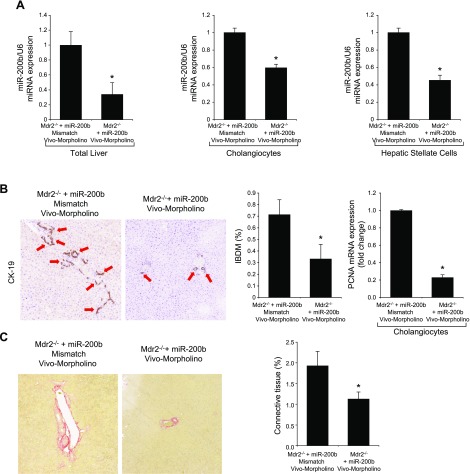
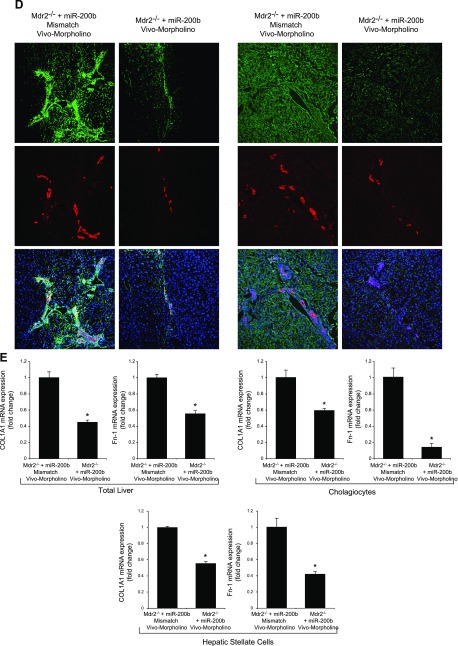
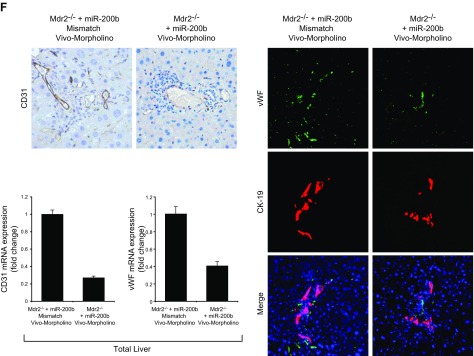
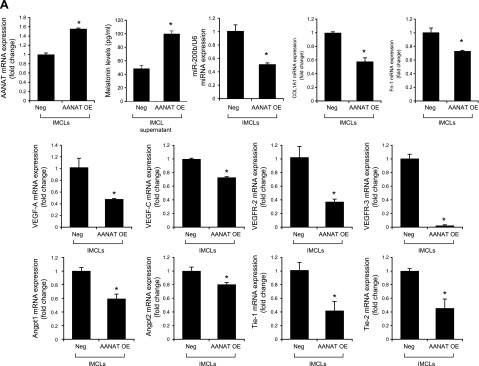
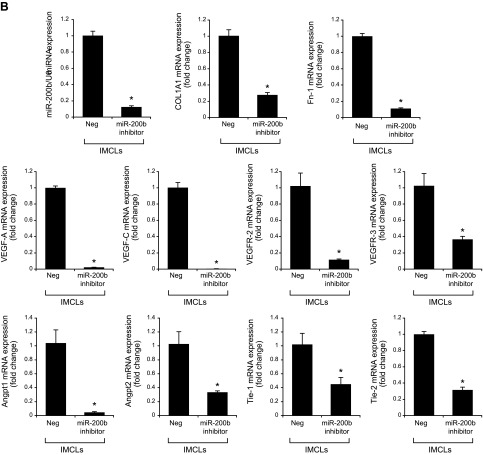
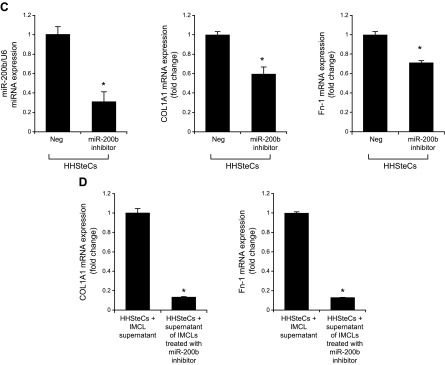
Melatonin therapy or prolonged exposure to complete darkness reduces biliary hyperplasia and liver fibrosis in bile-duct-ligated (BDL) rats; however, no information exists in primary sclerosing cholangitis (PSC). Thus, we aimed to determine the therapeutic effects of prolonged dark therapy or melatonin administration on hepatic fibrosis in the multidrug resistance gene 2-knockout (Mdr2-/-) mouse model of PSC. Melatonin levels, biliary mass, liver fibrosis, angiogenesis and miR-200b expression were evaluated in wild-type and Mdr2-/- mice exposed to darkness or melatonin treatment or in male patients with PSC and healthy controls. Mdr2-/- mice were also treated with miR-200b inhibitor or control before evaluating biliary mass, liver fibrosis, and angiogenesis. After overexpression of arylalkylamine N-acetyltransferase (AANAT; the enzyme regulating melatonin synthesis) or inhibition of miR-200b in cholangiocytes and hepatic stellate cells in vitro, we evaluated angiogenesis and fibrosis gene expression. After exposure to darkness or administration of melatonin, Mdr2-/- mice show elevated serum melatonin levels and inhibition of biliary mass, along with reduction of liver fibrosis and angiogenesis. MicroRNA PCR analysis demonstrated that miR-200b expression increased in Mdr2-/- mice and patients with PSC compared with controls and decreased in Mdr2-/- mice subjected to dark exposure or melatonin treatment. Inhibition of miR-200b in Mdr2-/- ablates biliary proliferation, liver fibrosis, and angiogenesis. In vitro, overexpression of AANAT or inhibition of miR-200b in cholangiocytes and hepatic stellate cells decreased the expression of miR-200b, angiogenesis, and fibrosis genes. Dark therapy or targeting melatonin/miR-200b axis may be important in the management of biliary damage and liver fibrosis in cholangiopathies including PSC.-Wu, N., Meng, F., Zhou, T., Han, Y., Kennedy, L., Venter, J., Francis, H., DeMorrow, S., Onori, P., Invernizzi, P., Bernuzzi, F., Mancinelli, R., Gaudio, E., Franchitto, A., Glaser, S., Alpini G. Prolonged darkness reduces liver fibrosis in a mouse model of primary sclerosing cholangitis by miR-200b down-regulation.

Keywords: angiogenesis; biliary epithelium; cholangiopathy; cholestasis; miRNA.


Conflict of interest statement

This work was supported by the Dr. Nicholas C. Hightower Centennial Chair of Gastroenterology (Baylor Scott & White), a Translational Genomics Research Institute (TGEN) seed grant, and a Veterans Affairs (VA) Research Career Scientist Award (to G.A.); and VA Merit Awards 5I01BX000574 (to G.A.) 5I01BX002192 (to S.G.), 1I01BX001724 (to F.M.), 1I01BX003031 (to H.F.), and 1IO1BX002638 (to S.D.); University of Rome “La Sapienza,” and Fondo per gli Investimenti della Ricerca di Base (FIRB) Accordi di Programma 2010–RBAP10Z7FS (to E.G.); U.S. National Institutes of Health (NIH), National Institute of Diabetes and Digestive and Kidney Diseases Grants DK054811, DK076898, DK107310, DK110035, and DK062975 (to G.A., F.M., and S.G.), DK108959 (to H.F.), and DK082435 to (S.D., N.W., and F.M.). This publication is the result of work supported by resources at the Central Texas Veterans Health Care System. The content is the responsibility of the authors alone, and does not necessarily reflect the views or policies of the Department of Veterans Affairs or the U.S. Government. G.A., A.F., and S.G. share senior authorship. The authors declare no conflicts of interest.

Figures

Figure 1.
Figure 1.
A) In Mdr2−/− mice, Aanat expression was reduced in pineal gland, but was enhanced in total liver and cholangiocytes. Aanat expression was increased in pineal gland of Mdr2−/− mice exposed to dark, but was decreased in pineal gland of Mdr2−/− mice treated with melatonin. Data are means ± sem of 6 evaluations from 6 different animals. *P < 0.05 vs. WT mice. #P < 0.05 vs. Mdr2−/− mice. B, C) Aanat expression was enhanced in total liver (B) and cholangiocytes (C) from Mdr2−/− mice, as well as from Mdr2−/− mice treated with melatonin, but was reduced in total liver and cholangiocytes from Mdr2−/− mice exposed to the dark. PCR data are means ± sem of 4 evaluations in cholangiocytes from 3 cumulative preparations of cholangiocytes from 4 mice (n = 12 mice). D) Melatonin serum levels were higher in Mdr2−/− mice than in normal WT mice, as well as in Mdr2−/− mice exposed to dark or treated with melatonin compared with WT mice. Data are means ± sem of 6 evaluations from 6 different animals. *P < 0.05 vs. WT mice. #P < 0.05 vs. Mdr2−/− mice. E, F) AANAT expression (E) and serum melatonin levels (F) were enhanced in male humans with late-stage PSC compared with controls. Data are means ± sem of 3 evaluations from 4 healthy control subjects and 4 male patients with PSC. *P < 0.05 vs. control samples.
Figure 2.
Figure 2.
A) In Mdr2−/− mice, the increase in IBDM (by immunohistochemistry for CK-19; CK-19–positive bile ducts indicated by red arrows) and biliary proliferation in isolated cholangiocytes was reduced by exposure to the dark or to melatonin. B) Dark exposure or melatonin did not alter the IBDM of normal WT (FVB/NJ) mice. PCR data are means ± sem of 4 evaluations in cholangiocytes collected from 3 cumulative preparations of cholangiocytes from 4 mice (n = 12 mice). Original magnification, ×25. *P < 0.05 vs. WT mice, #P < 0.05 vs. Mdr2−/− mice.
Figure 3.
Figure 3.
A–C) In Mdr2−/− mice, fibrosis was enhanced (A) and immunoreactivity was increased for COL1A1 and Fn-1 (B, C), compared with WT mice in which they were reduced by exposure to the dark or melatonin (10 different fields analyzed from each sample from 3 different animals). Dark exposure or melatonin treatment did not alter fibrosis in normal WT mice (A). Original magnification, ×25. D) Expression of Col1a1, Fn-1 and Tgf-β1 was increased in total liver and cholangiocytes and stellate cells from Mdr2−/− mice compared with WT mice, and was reduced by exposure to the dark or melatonin. Data are means ± sem of 6 evaluations in total liver samples collected from 6 separate animals, in cholangiocytes collected from 3 cumulative preparations from 4 mice (n = 12 mice), and in LCD-isolated stellate cells from 3 individual mice. *P < 0.05 vs. WT mice, #P < 0.05 vs. Mdr2−/− mice.
Figure 3.
Figure 3.
A–C) In Mdr2−/− mice, fibrosis was enhanced (A) and immunoreactivity was increased for COL1A1 and Fn-1 (B, C), compared with WT mice in which they were reduced by exposure to the dark or melatonin (10 different fields analyzed from each sample from 3 different animals). Dark exposure or melatonin treatment did not alter fibrosis in normal WT mice (A). Original magnification, ×25. D) Expression of Col1a1, Fn-1 and Tgf-β1 was increased in total liver and cholangiocytes and stellate cells from Mdr2−/− mice compared with WT mice, and was reduced by exposure to the dark or melatonin. Data are means ± sem of 6 evaluations in total liver samples collected from 6 separate animals, in cholangiocytes collected from 3 cumulative preparations from 4 mice (n = 12 mice), and in LCD-isolated stellate cells from 3 individual mice. *P < 0.05 vs. WT mice, #P < 0.05 vs. Mdr2−/− mice.
Figure 4.
Figure 4.
A–D) Immunoreactivity of VEGF-A/C, CD31, and vWF was increased in liver sections from Mdr2−/− compared with normal WT mice, and enhanced mRNA expression of Vegf-a/c, Vegfr-2/3, Angpt1/2, Tie-1/2, Cd31, and vWF in total liver and Vegf-a/c, Vegfr-2/3, Angpt1/2, and Tie-1/2 in cholangiocytes from Mdr2−/− compared with WT mice. Exposure of Mdr2−/− mice to darkness or melatonin treatment decreased the expression of VEGF-A/C, CD31, and vWF in liver sections (A, B), and Vegf-a/c, Vegfr-2/3, Angpt1/2, Tie-1/2, Cd31, and vWF in the selected samples compared with Mdr2−/− mice (C, D). Original magnification, ×40. E) Immunoreactivity for vWF was enhanced in liver sections from 1 patient with late-stage PSC compared with 1 healthy control, and mRNA expression of VEGF-A/C, VEGFR-2/3, ANGPT1/2, TIE-1/2, CD31, and vWF was increased in human late-stage PSC samples compared with control samples. Original magnification, ×40. Data are means ± sem of 3 PCR reactions from 4 different samples obtained from 4 healthy male control subjects and 4 male patients with PSC. *P < 0.05 vs. control samples.
Figure 4.
Figure 4.
A–D) Immunoreactivity of VEGF-A/C, CD31, and vWF was increased in liver sections from Mdr2−/− compared with normal WT mice, and enhanced mRNA expression of Vegf-a/c, Vegfr-2/3, Angpt1/2, Tie-1/2, Cd31, and vWF in total liver and Vegf-a/c, Vegfr-2/3, Angpt1/2, and Tie-1/2 in cholangiocytes from Mdr2−/− compared with WT mice. Exposure of Mdr2−/− mice to darkness or melatonin treatment decreased the expression of VEGF-A/C, CD31, and vWF in liver sections (A, B), and Vegf-a/c, Vegfr-2/3, Angpt1/2, Tie-1/2, Cd31, and vWF in the selected samples compared with Mdr2−/− mice (C, D). Original magnification, ×40. E) Immunoreactivity for vWF was enhanced in liver sections from 1 patient with late-stage PSC compared with 1 healthy control, and mRNA expression of VEGF-A/C, VEGFR-2/3, ANGPT1/2, TIE-1/2, CD31, and vWF was increased in human late-stage PSC samples compared with control samples. Original magnification, ×40. Data are means ± sem of 3 PCR reactions from 4 different samples obtained from 4 healthy male control subjects and 4 male patients with PSC. *P < 0.05 vs. control samples.
Figure 5.
Figure 5.
A) The expression of miR-10a, -10b, -200b, and -335 increased in Mdr2−/− compared with WT mice and decreased in Mdr2−/− mice exposed to darkness. The expression of miR-29b decreased in Mdr2−/− compared with WT mice and increased in Mdr2−/− mice exposed to darkness. Data are means ± sem of 3 experments from cholangiocytes from 3 cumulative preparations from 4 mice (n = 12 mice). B) By miRNA quantitative PCR, miR-200b expression increased in cholangiocytes and hepatic stellate cells from Mdr2−/− mice but decreased in Mdr2−/− mice exposed to prolonged dark and treated with melatonin. Data are means ± sem of 6 experiments from 3 cumulative preparations of cholangiocytes from 4 mice (n = 12 mice); *P < 0.05 vs. WT mice; #P < 0.05 vs. Mdr2−/− mice. Expression of miR-200b was enhanced in human late-stage PSC samples compared with healthy control samples. The RNA was extracted from paraffin-embedded sections from samples obtained from 4 healthy control subjects and 4 male patients with late-stage PSC. Data are means ± sem of 3 different PCR reactions. *P < 0.05 vs. control samples. Melatonin decreased the expression in vitro of miR-200b in IMCLs compared with the basal value. Data are means ± sem of 3 evaluations of 3 individual preparations of IMCLs. *P < 0.05 vs. basal.
Figure 6.
Figure 6.
A) Treatment of Mdr2−/− mice with an miR-200b inhibitor decreased the expression of miR-200b in total liver. B) IBDM (original magnification, ×25) and Pcna mRNA expression decreased in isolated cholangiocytes. CE) Liver fibrosis (C) and immunoreactivity for COL1A1 and Fn-1 (D) decreased in liver sections, as did the expression of Col1a1 and Fn-1 in total liver samples and in isolated cholangiocytes and stellate cells (E). F, G) The immunoreactivity for CD31 and vWF in liver sections (F) and the expression of Vegf-a/c, Vegfr-2/3, Angpt1/2, Tie-1/2, Cd31, and vWF in total liver and Vegf-a/c, Vegfr-2/3, Angpt1/2, and Tie-1/2 in cholangiocytes (G) decreased compared with levels in control mice. Data are means ± sem of 6 evaluations in total liver samples collected from 6 separate animals; of 3 evaluations in cholangiocytes collected from 2 cumulative preparations from 3 mice (n = 6 mice); and of 6 evaluations of LCD-isolated stellate cells from 3 individual mice. *P < 0.05 vs. vehicle-treated Mdr2−/− mice.
Figure 6.
Figure 6.
A) Treatment of Mdr2−/− mice with an miR-200b inhibitor decreased the expression of miR-200b in total liver. B) IBDM (original magnification, ×25) and Pcna mRNA expression decreased in isolated cholangiocytes. CE) Liver fibrosis (C) and immunoreactivity for COL1A1 and Fn-1 (D) decreased in liver sections, as did the expression of Col1a1 and Fn-1 in total liver samples and in isolated cholangiocytes and stellate cells (E). F, G) The immunoreactivity for CD31 and vWF in liver sections (F) and the expression of Vegf-a/c, Vegfr-2/3, Angpt1/2, Tie-1/2, Cd31, and vWF in total liver and Vegf-a/c, Vegfr-2/3, Angpt1/2, and Tie-1/2 in cholangiocytes (G) decreased compared with levels in control mice. Data are means ± sem of 6 evaluations in total liver samples collected from 6 separate animals; of 3 evaluations in cholangiocytes collected from 2 cumulative preparations from 3 mice (n = 6 mice); and of 6 evaluations of LCD-isolated stellate cells from 3 individual mice. *P < 0.05 vs. vehicle-treated Mdr2−/− mice.
Figure 7.
Figure 7.
A) In IMCLs stably trasfected with AANAT, Aanat mRNA expression and melatonin levels were enhanced in cholangiocyte supernatant but decreased expression of miR-200b, Col1a1, Fn-1, Vegf-a/c, Vegfr-2/3, Angpt1/2, and Tie-1/2. Data are means ± sem of 3 evaluations from 3 individual preparations of biliary cell lines. *P < 0.05 vs. Neg. B, C) Treatment with a miR-200b inhibitor decreased the expression of Col1a1, Fn-1, Vegf-a/c, Vegfr-2/3, Angpt1/2, and Tie-1/2 in IMCLs (B) and the expression of COL1A1 and FN-1 in HHSteCs (C). Data are means ± sem of 3 evaluations from 3 individual preparations of cholangiocyte or stellate lines. *P < 0.05 vs. control cell lines. D) When HHSteCs were treated with supernatant from IMCLs treated with miR-200b inhibitor, expression of COL1A1 and Fn-1 was decreased compared with HHSteCs treated with control IMCL. Data are means ± sem of 3 evaluations from 3 individual preparations of IMCLs. *P < 0.05 vs. stellate cells treated with control cholangiocyte supernatant.
Figure 7.
Figure 7.
A) In IMCLs stably trasfected with AANAT, Aanat mRNA expression and melatonin levels were enhanced in cholangiocyte supernatant but decreased expression of miR-200b, Col1a1, Fn-1, Vegf-a/c, Vegfr-2/3, Angpt1/2, and Tie-1/2. Data are means ± sem of 3 evaluations from 3 individual preparations of biliary cell lines. *P < 0.05 vs. Neg. B, C) Treatment with a miR-200b inhibitor decreased the expression of Col1a1, Fn-1, Vegf-a/c, Vegfr-2/3, Angpt1/2, and Tie-1/2 in IMCLs (B) and the expression of COL1A1 and FN-1 in HHSteCs (C). Data are means ± sem of 3 evaluations from 3 individual preparations of cholangiocyte or stellate lines. *P < 0.05 vs. control cell lines. D) When HHSteCs were treated with supernatant from IMCLs treated with miR-200b inhibitor, expression of COL1A1 and Fn-1 was decreased compared with HHSteCs treated with control IMCL. Data are means ± sem of 3 evaluations from 3 individual preparations of IMCLs. *P < 0.05 vs. stellate cells treated with control cholangiocyte supernatant.

References

    1. Maroni L., Haibo B., Ray D., Zhou T., Wan Y., Meng F., Marzioni M., and Alpini G. (2015) Functional and structural features of cholangiocytes in health and disease. Cell Mol Gastroenterol Hepatol 1, 368–380 - PMC - PubMed
    1. Aron J. H., and Bowlus C. L. (2009) The immunobiology of primary sclerosing cholangitis. Semin. Immunopathol. 31, 383–397 - PMC - PubMed
    1. Melum E., Franke A., Schramm C., Weismüller T. J., Gotthardt D. N., Offner F. A., Juran B. D., Laerdahl J. K., Labi V., Björnsson E., Weersma R. K., Henckaerts L., Teufel A., Rust C., Ellinghaus E., Balschun T., Boberg K. M., Ellinghaus D., Bergquist A., Sauer P., Ryu E., Hov J. R., Wedemeyer J., Lindkvist B., Wittig M., Porte R. J., Holm K., Gieger C., Wichmann H. E., Stokkers P., Ponsioen C. Y., Runz H., Stiehl A., Wijmenga C., Sterneck M., Vermeire S., Beuers U., Villunger A., Schrumpf E., Lazaridis K. N., Manns M. P., Schreiber S., and Karlsen T. H. (2011) Genome-wide association analysis in primary sclerosing cholangitis identifies two non-HLA susceptibility loci. Nat. Genet. 43, 17–19 - PMC - PubMed
    1. Eaton J. E., Talwalkar J. A., Lazaridis K. N., Gores G. J., and Lindor K. D. (2013) Pathogenesis of primary sclerosing cholangitis and advances in diagnosis and management. Gastroenterology 145, 521–536 - PMC - PubMed
    1. Fickert P., Fuchsbichler A., Wagner M., Zollner G., Kaser A., Tilg H., Krause R., Lammert F., Langner C., Zatloukal K., Marschall H. U., Denk H., and Trauner M. (2004) Regurgitation of bile acids from leaky bile ducts causes sclerosing cholangitis in Mdr2 (Abcb4) knockout mice. Gastroenterology 127, 261–274 - PubMed

Publication types

LinkOut - more resources