. 2017 Jul 19;37(29):7008-7022.
doi: 10.1523/JNEUROSCI.0093-17.2017. Epub 2017 Jun 20.

Representations of Time-Varying Cochlear Implant Stimulation in Auditory Cortex of Awake Marmosets (Callithrix jacchus)

Affiliations

Representations of Time-Varying Cochlear Implant Stimulation in Auditory Cortex of Awake Marmosets (Callithrix jacchus)

Luke A Johnson et al. J Neurosci. .

Abstract

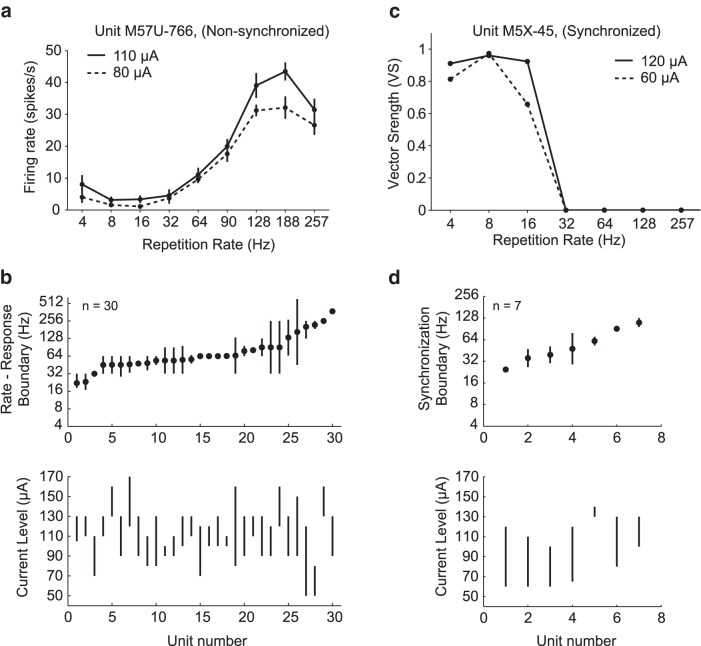
Electrical stimulation of the auditory periphery organ by cochlear implant (CI) generates highly synchronized inputs to the auditory system. It has long been thought such inputs would lead to highly synchronized neural firing along the ascending auditory pathway. However, neurophysiological studies with hearing animals have shown that the central auditory system progressively converts temporal representations of time-varying sounds to firing rate-based representations. It is not clear whether this coding principle also applies to highly synchronized CI inputs. Higher-frequency modulations in CI stimulation have been found to evoke largely transient responses with little sustained firing in previous studies of the primary auditory cortex (A1) in anesthetized animals. Here, we show that, in addition to neurons displaying synchronized firing to CI stimuli, a large population of A1 neurons in awake marmosets (Callithrix jacchus) responded to rapid time-varying CI stimulation with discharges that were not synchronized to CI stimuli, yet reflected changing repetition frequency by increased firing rate. Marmosets of both sexes were included in this study. By comparing directly each neuron's responses to time-varying acoustic and CI signals, we found that individual A1 neurons encode both modalities with similar firing patterns (stimulus-synchronized or nonsynchronized). These findings suggest that A1 neurons use the same basic coding schemes to represent time-varying acoustic or CI stimulation and provide new insights into mechanisms underlying how the brain processes natural sounds via a CI device.SIGNIFICANCE STATEMENT In modern cochlear implant (CI) processors, the temporal information in speech or environmental sounds is delivered through modulated electric pulse trains. How the auditory cortex represents temporally modulated CI stimulation across multiple time scales has remained largely unclear. In this study, we compared directly neuronal responses in primary auditory cortex (A1) to time-varying acoustic and CI signals in awake marmoset monkeys (Callithrix jacchus). We found that A1 neurons encode both modalities using similar coding schemes, but some important differences were identified. Our results provide insights into mechanisms underlying how the brain processes sounds via a CI device and suggest a candidate neural code underlying rate-pitch perception limitations often observed in CI users.

Keywords: auditory cortex; cochlear implant; marmoset.


Figures

Figure 1.
Figure 1.
Assessment of residual acoustic hearing in animals unilaterally implanted with CI electrodes. Signals measured from intracochlear CI electrodes 9–2 (apical-basal) in the four animals used in this study. a, Acoustic responses from the two animals not treated with intrascalar injections of the ototoxic drug neomycin. Responses from one animal (M57U) exhibited short latency responses to acoustic clicks delivered at high sound levels (left, black traces). Signals measured from this animal with the implanted ear occluded with an ear impression material are overlaid on the plot (left, red traces). Ear plug significantly reduced the auditory responses, which was the condition used in all animals during cortical recording sessions to remove possible auditory input to the implanted ear. Only weak auditory responses were observed in the other animal (M77W). Traces shown in these plots are the average of 60 click presentations. The maximum sound level typically used during the reported cortical recordings was 80 dB SPL. The short-latency responses at high sound levels were presumed to be the cochlear microphonic and auditory nerve compound action potential. b, Acoustic responses of the two neomycin-treated animals showed no short latency responses, as expected given that the cochlea was deafened with neomycin sulfate immediately before CI electrode implantation. These traces are the average of 1200 click presentations. c, Signals measured from the two neomycin-treated animals using a scale of 2.5 μV instead of 50 μV. These plots show the same signals as in b (black trace), with two additional recording conditions: implanted (neomycin-treated) ear plugged (red trace) and intact ear plugged (blue trace). The red trace is almost identical to the black trace, indicating that plugging the implanted ear had no effect on the recorded signal. However, the signal measured with the intact ear plugged is significantly reduced (blue trace). Short-latency responses (<2.5 ms) are absent in all traces. These data suggest that the long-latency signals (>2.5 ms) observed in neomycin-treated animals are from brainstem responses due to auditory input to the unimplanted ear, not the implanted ear.
Figure 2.
Figure 2.
CI stimulus artifact removal. Electrical artifacts caused by CI stimulation were removed from neural recordings using a notch filter. a, Electrical artifacts were typically an order of magnitude larger than spiking activity. Raw neural signal was recorded during a 500 ms duration; 488 Hz stimulus is shown. Without artifact removal, such high stimulation rates prevent reliable sorting during the stimulus period. b, Frequency spectrum of the raw signal shown in a. Spectral peaks occur at integer multiples of the stimulus repetition rate. c, A notch filter was created with spectral nulls at integer multiples of the stimulus repetition rate. d, The raw signal was digitally filtered with the notch filter, allowing spikes to be recovered. e, Spikes were sorted offline using a custom template-based sorting MATLAB program. Spikes obtained after filtering were reduced in amplitude (black), but maintained similar shape as unfiltered spikes (gray). f, SNR of isolated units was large enough to very reliably sort units after notch filtering (median = 28.1 dB). g, Neural responses to CI stimulus delivered at 4–488 Hz. Only responses to stimuli ≥128 Hz were notch filtered. For visualization, stimulus artifact in unfiltered signals is highlighted red.
Figure 3.
Figure 3.
CI stimulus synchronized responses. Synchronized responses to CI pulse trains. ae, Response and analysis of an example synchronized unit. a, Electrode tuning function shows responses to a single CI pulse delivered to each of the seven CI electrode pairs. b, Response to increasing current levels. Monotonic response to current level was typical. c, Response to repetition rate stimuli. Each CI stimulus evoked one to two spikes for low repetition rate stimuli <32 Hz, but evoked primarily onset responses to high repetition rate stimuli. d, Firing rate response profile shows maximum response to 12 and 16 Hz stimuli. e, Temporal response profile based on vector strength. Nonsignificant vector strength values (Rayleigh statistic <13.8, p > 0.001) were set to zero. The synchronization boundary was calculated to be 79.1 Hz, beyond which there was no significant phase locking. f, g, Additional examples of units with synchronized responses. In the right subplots, arrows indicate synchronization boundaries.
Figure 4.
Figure 4.
CI stimulus nonsynchronized responses. Nonsynchronized responses to CI pulse trains are shown. ae, Response and analysis of a nonsynchronized unit. a, Electrode tuning function shows responses to a 257 Hz CI stimulus train delivered to each of six CI electrode pairs (electrode pair 3–2 was not used in this animal due to large impedance of contact 2). Electrode 6–5 was used for subsequent testing. b, Response to increasing current levels. Monotonic response to current level was typical. c, Response to repetition rate stimuli. High repetition rate stimuli >45 Hz evoked strong firing response that was sustained throughout the stimulus duration. d, Firing rate response profile shows maximum response to 257 Hz stimuli. The rate–response boundary was calculated to be 45.2 Hz. e, Temporal response profile based on vector strength. Nonsignificant vector strength values (Rayleigh statistic <13.8, p > 0.001) were set to zero. The only stimulus with significant phase locking was 64 Hz. f, g, Additional examples of units with nonsynchronized responses. In the right subplots, arrows indicate rate–response boundaries.
Figure 5.
Figure 5.
Classification based on synchronization and firing rate–response to CI and acoustic stimuli. a, Population responses to CI pulse trains. The horizontal dashed line at 13.8 indicates the significance level of the Rayleigh test (p < 0.001). The vertical dashed line indicates a discharge rate ratio of 1.0 (see Materials and Methods). Open circles indicate units classified as synchronized (n = 59). Crosses indicate units classified in the nonsynchronized population (n = 113). Crosses falling above the Rayleigh significance level were still classified as nonsynchronized because the firing rate response to the 8 Hz stimulus was not significantly different from spontaneous firing rate. Points indicate neurons with mixed responses (n = 15). Units recorded from the left auditory cortex (AC) are black, units from right AC are green. b, Population responses to acoustic click trains. Open circles indicate units classified as synchronized (n = 79). Crosses indicate units classified in the nonsynchronized population (n = 131). Points indicate neurons with mixed responses (n = 27).
Figure 6.
Figure 6.
Units responsive to CI and acoustic stimuli are typically classified the same. a, Example of unit with synchronized responses to both CI and acoustic stimuli. b, Of 34 units with synchronized CI response also tested with acoustic stimuli, the majority (n = 22) also had synchronized response to acoustic click train stimuli. c, Example of unit with nonsynchronized response to both CI and acoustic stimuli. d, Of 62 units with nonsynchronized CI response also tested with acoustic stimuli, the majority (n = 50) also had nonsynchronized response to acoustic click train stimuli.
Figure 7.
Figure 7.
Distribution of response boundaries, CI and acoustic. a, Synchronization boundaries of synchronized populations (CI, left, red; acoustic, right, blue). There was no significant difference between the distributions of synchronization boundaries (p = 0.253, WRS test, median CI = 41.2 Hz, median acoustic = 28.6 Hz). b, Scatterplot of synchronization boundaries in units with synchronized CI and acoustic responses (n = 22, r = 0.369, p = 0.091, Pearson) c, Rate–response boundaries of nonsynchronized populations. There was no significant difference between the distributions of rate–response boundaries (p = 0.356, WRS test, median CI = 64.2 Hz, median acoustic = 64.0 Hz). d, Scatterplot of rate–response boundaries in units with nonsynchronized CI and acoustic responses (n = 50, r = 0.613, p = 2.2e-6, Pearson) e, Combination of temporal and rate representations of the range of tested repetition rates. Each curve is the cumulative sum of the histograms representing the synchronized and nonsynchronized populations in a, or c, respectively. Dashed lines show the percentage of units with synchronization boundaries greater than or equal to a given repetition rates. Solid line shows the percentage of units with rate–response boundaries less than or equal to a given repetition rate.
Figure 8.
Figure 8.
Effect of current level on response boundaries. Effect of current level on response boundaries of nonsynchronized (left) and synchronized units (right). a, Example of nonsynchronized unit tested at two current levels. Lower current evoked lower firing rates, but the rate–response profile was similarly shaped. b, Rate–response boundaries of units with nonsynchronized responses. Top, Black circles indicate mean rate–response boundaries for each unit over the current levels tested. Units are ordered by their mean rate–response boundaries. Vertical lines indicate the range of minimum and maximum rate–response boundaries measured in each unit. Bottom, Vertical lines indicate ranges of current levels tested for each unit shown in the top. At least two current levels were tested in each unit. c, Example of synchronized unit tested at two current levels. Lower current evoked lower vector strength, but temporal response profile was similar shape. d, Synchronization boundaries of units with synchronized responses. Format is same as in b.
Figure 9.
Figure 9.
Population averages: synchronization and rate–response profiles. a, Vector strength of the CI and acoustic synchronized populations of units (mean ± SEM). Only units tested at repetition rates 4–488 Hz were included in analysis. Vector strength at 8 Hz was slightly stronger for acoustic compared with CI stimuli (t test, p < 0.05). b, Mean firing rate of the CI and acoustic nonsynchronized populations of units. Firing rates were similar at all repetition rates except the highest repetition rate analyzed, 488 Hz (t test, p < 0.05).
Figure 10.
Figure 10.
Response type based on BF and recording depth. a, Distributions of acoustic BF of CI synchronized and nonsynchronized populations. Bars represent the percentage of units in each category with BFs between the frequencies indicated on the x-axis label (i.e., between 0.5 and 1 kHz, between 1 and 2 kHz, etc.) There was a significant difference between the BFs of the two populations (p = 0.0153, WRS test, median synchronized BF = 5.7 kHz, median nonsynchronized BF = 9.2 kHz). b, Scatterplot of synchronized population BF versus synchronization boundary of CI and acoustic synchronized populations. There was no significant correlation between synchronization boundary and BF in either population (CI: p = 0.26, acoustic: p = 0.42, Pearson). c, Distributions of the recording depth of CI synchronized and nonsynchronized populations. There was no difference between the median recording depths (p = 0.326, WRS test). d, Scatterplot of maximum vector strength versus recording depth for CI and acoustic synchronized populations. There was no significant correlation in either population (CI: p = 0.87, acoustic: p = 0.46, Pearson).
Figure 11.
Figure 11.
Unit thresholds over time after CI implantation. a, Unit thresholds over time after CI implantation in the left and right hemispheres (LH, RH) of each animal. Thresholds were based on acoustic tone rate-level functions and reflected the lowest sound level that evoked a significant firing rate response. Individual units recorded in the LH and RH are denoted by closed and open circles, respectively. A moving average filter (length = 20 units) was applied to the LH and RH data and is displayed using solid and dashed lines, respectively. Unit counts (LH, RH) for each animal were as follows: M57U (211, 254), M77W (46, 52), M5X (184, 88), and M3Y (48, 56). b, Mean and SD of the unit thresholds at four time periods, 0–100, 100–200, 200–300, and 300–400 d after CI implantation, are shown for each animal (LH and RH combined). Relatively stable mean threshold values can be seen throughout the recording periods.

Comment in

Similar articles

Cited by

References

    1. Baumann U, Nobbe A (2004) Pulse rate discrimination with deeply inserted electrode arrays. Hear Res 196:49–57. 10.1016/j.heares.2004.06.008 - DOI - PubMed
    1. Beitel RE, Vollmer M, Raggio MW, Schreiner CE (2011) Behavioral training enhances cortical temporal processing in neonatally deafened juvenile cats. J Neurophysiol 106:944–959. 10.1152/jn.00731.2010 - DOI - PMC - PubMed
    1. Bendor D, Wang X (2007) Differential neural coding of acoustic flutter within primate auditory cortex. Nat Neurosci 10:763–771. 10.1038/nn1888 - DOI - PubMed
    1. Bendor D, Wang X (2008) Neural response properties of primary, rostral, and rostrotemporal core fields in the auditory cortex of marmoset monkeys. J Neurophysiol 100:888–906. 10.1152/jn.00884.2007 - DOI - PMC - PubMed
    1. Chambers AR, Hancock KE, Sen K, Polley DB (2014) Online stimulus optimization rapidly reveals multidimensional selectivity in auditory cortical neurons. J Neurosci 34:8963–8975. 10.1523/JNEUROSCI.0260-14.2014 - DOI - PMC - PubMed

Publication types

LinkOut - more resources