. 2017 Jun 21;18(6):1323.
doi: 10.3390/ijms18061323.

Diverse Regulation of Vitamin D Receptor Gene Expression by 1,25-Dihydroxyvitamin D and ATRA in Murine and Human Blood Cells at Early Stages of Their Differentiation

Affiliations

Diverse Regulation of Vitamin D Receptor Gene Expression by 1,25-Dihydroxyvitamin D and ATRA in Murine and Human Blood Cells at Early Stages of Their Differentiation

Sylwia Janik et al. Int J Mol Sci. .

Abstract

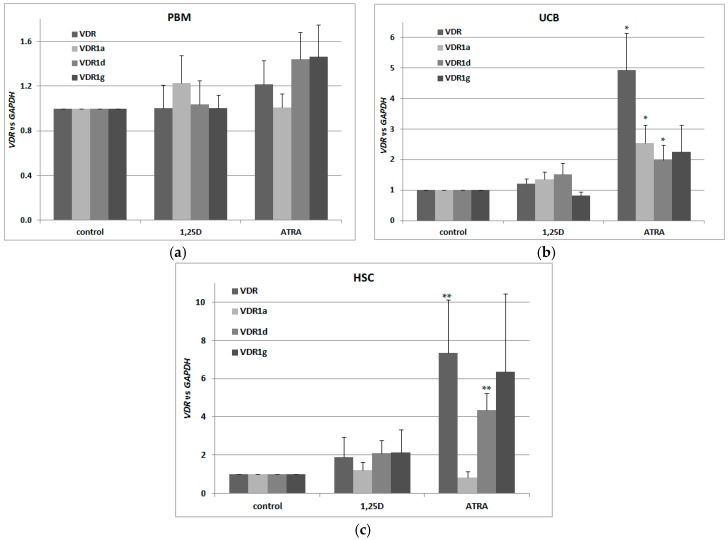
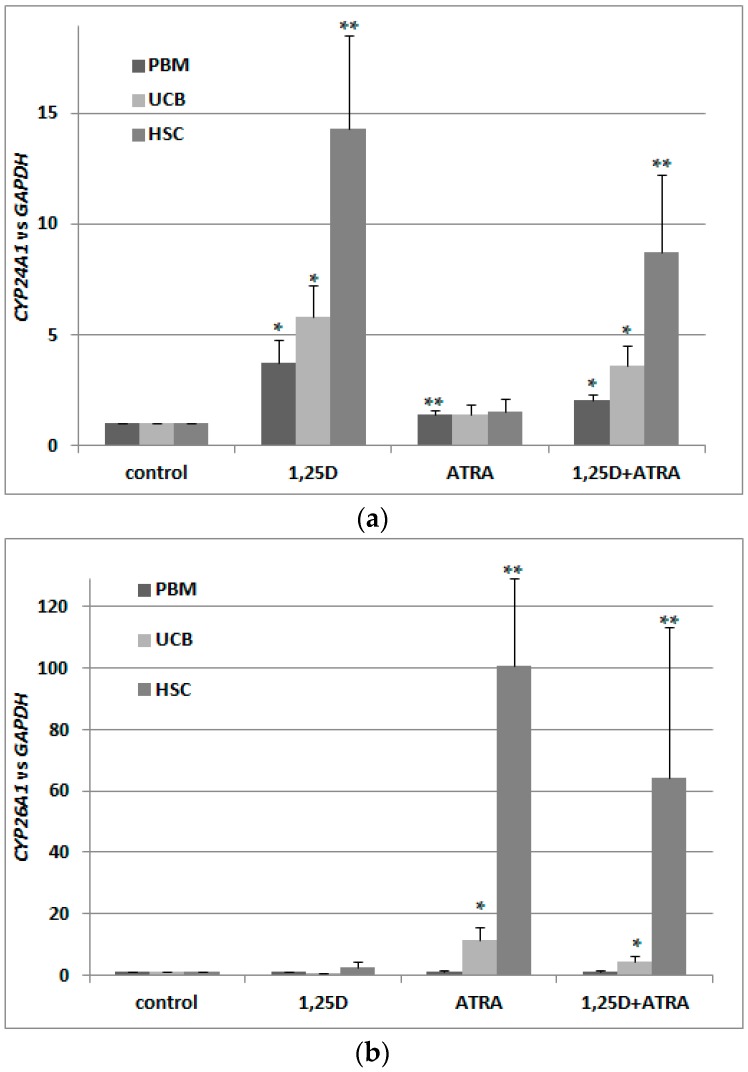
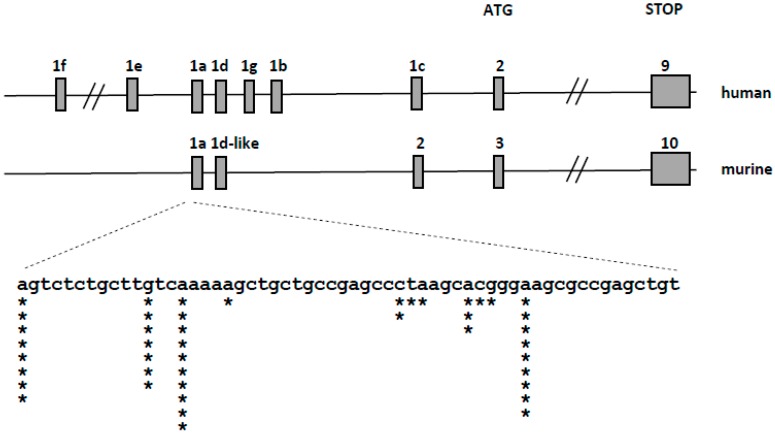
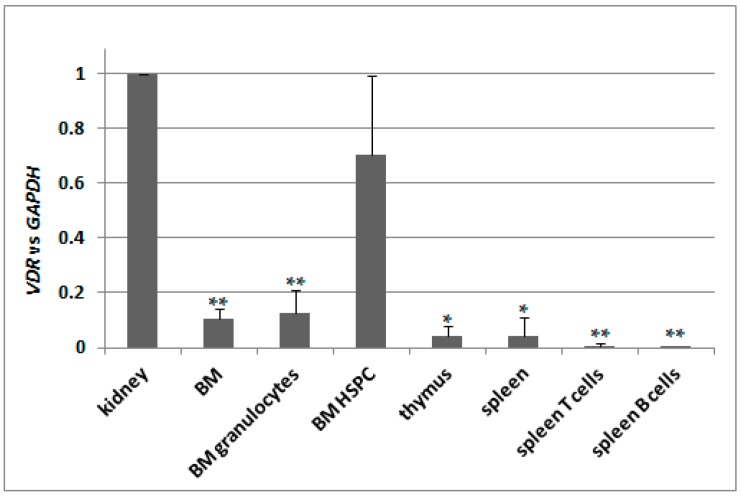
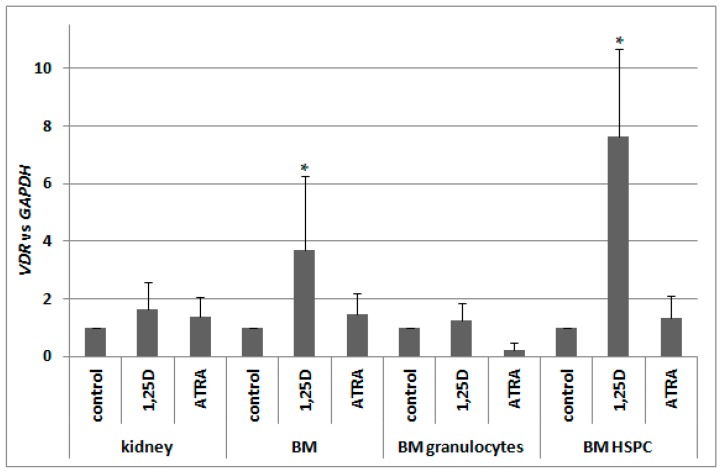
Vitamin D receptor (VDR) is present in multiple blood cells, and the hormonal form of vitamin D, 1,25-dihydroxyvitamin D (1,25D) is essential for the proper functioning of the immune system. The role of retinoic acid receptor α (RARα) in hematopoiesis is very important, as the fusion of RARα gene with PML gene initiates acute promyelocytic leukemia where differentiation of the myeloid lineage is blocked, followed by an uncontrolled proliferation of leukemic blasts. RARα takes part in regulation of VDR transcription, and unliganded RARα acts as a transcriptional repressor to VDR gene in acute myeloid leukemia (AML) cells. This is why we decided to examine the effects of the combination of 1,25D and all-trans-retinoic acid (ATRA) on VDR gene expression in normal human and murine blood cells at various steps of their development. We tested the expression of VDR and regulation of this gene in response to 1,25D or ATRA, as well as transcriptional activities of nuclear receptors VDR and RARs in human and murine blood cells. We discovered that regulation of VDR expression in humans is different from in mice. In human blood cells at early stages of their differentiation ATRA, but not 1,25D, upregulates the expression of VDR. In contrast, in murine blood cells 1,25D, but not ATRA, upregulates the expression of VDR. VDR and RAR receptors are present and transcriptionally active in blood cells of both species, especially at early steps of blood development.

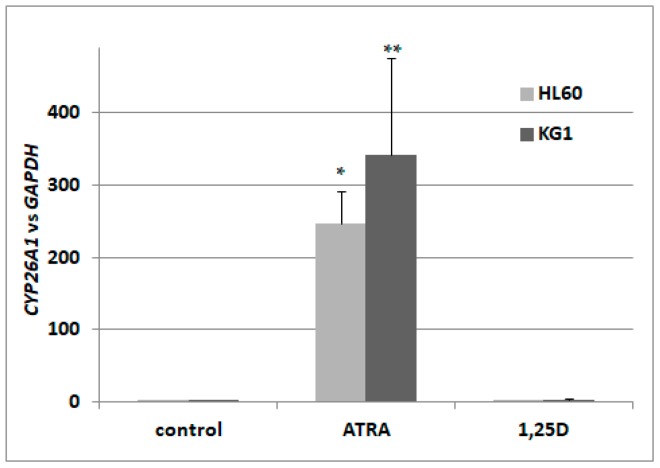
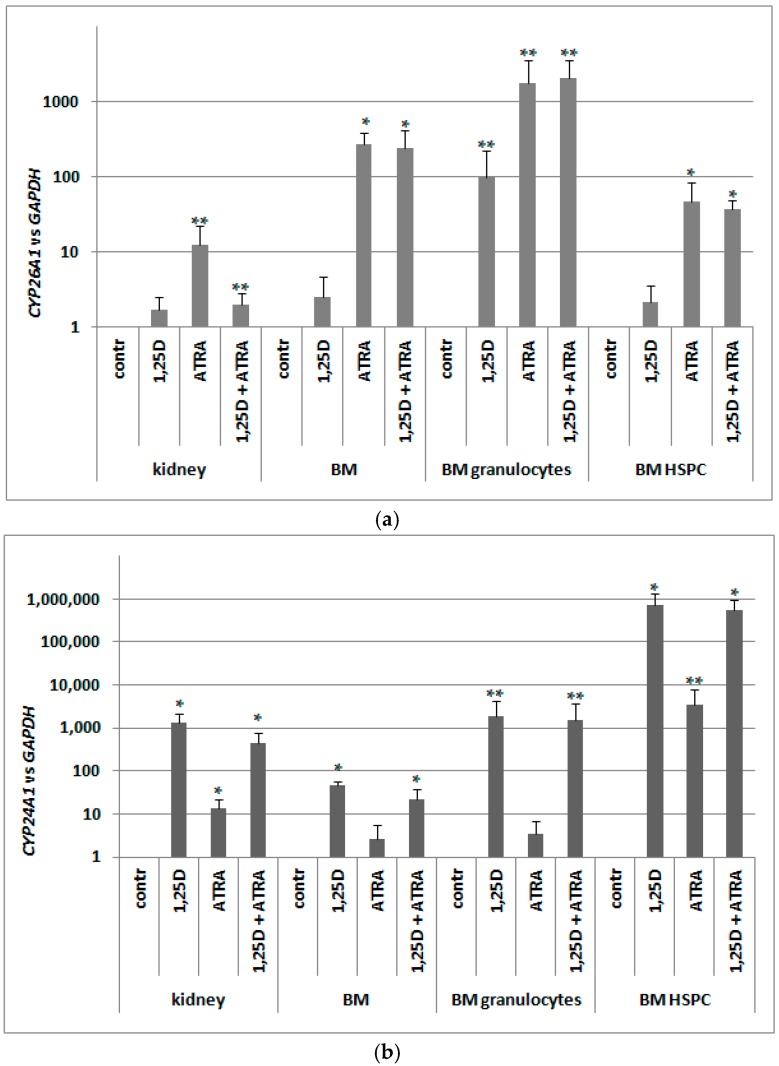
Keywords: CYP24A1; CYP26A1; blood cells; differentiation; expression; hematopoietic stem cells; retinoic acid receptors; vitamin D receptor.


Conflict of interest statement

The authors declare no conflicts of interest.

Figures

Figure A1
Figure A1
Graphical representation of transcriptional variants of human VDR detected in Real-time PCR. Primer sequences are given in Materials and Methods. All VDR transcripts were detected using primers which amplify product on the border of exons 7 and 8 (VDR). Transcripts that start at exon 1a were detected using primers which amplify product on the border of exons 1a and 2 (VDR1a). Transcripts which start at exon 1d were detected using primers which amplify product on the border of exons 1d and 2 (VDR1d) and transcripts which start at exon 1g were detected using primers which amplify product on the border of exons 1g and 2 (VDR1g). Black boxes represent coding exons, gray boxes represent noncoding exons and white boxes represent defined promoter regions.
Figure A2
Figure A2
Human CD34+ cells were isolated from UCB as described in Materials and Methods. The cells before sorting, and the cells after magnetic sorting were stained using CD34-PE antibody. Cell fluorescence was detected in flow cytometry using Accuri flow cytometer (Becton Dickinson). Red line separates CD34-negative cells (left side of red line) from CD34-positive cells (right side of red line). Sample staining is presented for unsorted (a) and sorted (b) cells.
Figure A3
Figure A3
Murine BM leukocytes, T cells and B cells were sorted as described in Materials and Methods. (a) Murine spleen cells were stained with anti-CD3-APC and anti-CD19-PE antibodies to isolate mature T (red gate) and B (yellow gate) cells, respectively; (b) Bone marrow cells were stained with anti-CD45-FITC antibody to isolate granulocytes, using CD45/SSC-based sorting criteria (green gate). Cells were sorted using FACS-Aria (Becton Dickinson).
Figure 1
Figure 1
Expression of retinoic acid 4-hydroxylase gene (CYP26A1) in acute myeloid leukemia (AML) cell lines exposed to all-trans-retinoic acid (ATRA) or to 1,25-dihydroxyvitamin D (1,25D). HL60 and KG1 cells were exposed to 1 μM ATRA or to 10 nM 1,25D and after 96 h the expression of CYP26A1 mRNA was measured by Real-time polymerase chain reaction (PCR). The bars represent mean values (±standard error of the mean (SEM)) of the fold changes in mRNA levels relative to glyceraldehyde 3-phosphate dehydrogenase (GAPDH) mRNA levels. Values significantly different from these obtained for respective control cells are marked with asterisks (* p < 0.01, ** p < 0.05).
Figure 2
Figure 2
Regulation of VDR by 1,25D or ATRA in human blood cells. Human blood cells were isolated as described in Materials and Methods. The cells were exposed ex vivo to 10 nM 1,25D or to 1 μM ATRA for 96 h. Then mRNA was isolated and expression of VDR transcriptional variants was measured by Real-time PCR for peripheral blood of healthy adults (PBM) (a), mononuclear cells from human umbilical cord blood (UCB) (b) and hematopoietic stem cells (HSC) (c). The bars represent mean values (±SEM) of the fold changes in mRNA levels relative to GAPDH mRNA levels. Values that differ significantly from these obtained for respective control are marked with asterisks (* p < 0.01, ** p < 0.05).
Figure 3
Figure 3
Transcriptional activity of VDR (a) and RARs (b) in human blood cells. Human blood cells were isolated as described in Materials and Methods. The cells were exposed ex vivo to 10 nM 1,25D ± 1 μM ATRA for 96 h. Then mRNA was isolated and CYP24A1 (a) or CYP26A1 (b) expression was measured by Real-time PCR. The bars represent mean values (±SEM) of the fold changes in mRNA levels relative to GAPDH mRNA levels. Values that are significantly higher than from these obtained for respective control are marked with asterisks (* p < 0.01, ** p < 0.05).
Figure 4
Figure 4
Organization of the human (upper panel) and murine (middle panel) VDR locus. Gray boxes represent exons. The expanded view (bottom panel) represents the genomic sequence surrounding the transcription start sites of the murine transcripts—asterisks represent the localization of the start sites identified during 5′-RACE, the number of asterisks—the number of transcripts starting at a given site.
Figure 5
Figure 5
Expression of VDR in C57BL/6 mice. Tissues from 2 to 9 mice were isolated as described in Materials and Methods. mRNA was isolated and VDR expression was measured by Real-time PCR. The bars represent mean values (±SEM) of the fold changes in mRNA levels relative to GAPDH mRNA levels. Values that are significantly different from these obtained for kidney are marked with asterisks (* p < 0.01, ** p < 0.05).
Figure 6
Figure 6
Regulation of VDR by 1,25D or ATRA in murine cells. Tissues from 3 to 10 mice were isolated as described in Materials and Methods. The cells were exposed ex vivo to 10 nM 1,25D or to 1 μM ATRA for 96 h. Then mRNA was isolated and VDR expression was measured by Real-time PCR. The bars represent mean values (±SEM) of the fold changes in mRNA levels relative to GAPDH mRNA levels. Values that differ significantly (p < 0.01) from those obtained for respective controls are marked with asterisks.
Figure 7
Figure 7
Transcriptional activity of RARs (a) and VDR (b) in murine cells. Tissues from 3 to 8 mice were isolated as described in Materials and Methods. The cells were exposed ex vivo to 10 nM 1,25D ± 1 μM ATRA for 96 h. Then mRNA was isolated and CYP26A1 (a) or CYP24A1 (b) expression was measured by Real-time PCR. The bars represent mean values (±SEM) of the fold changes in mRNA levels relative to GAPDH mRNA levels. Values that are significantly higher than these obtained for respective control are marked with asterisks (* p < 0.01, ** p < 0.05).

References

    1. Rhinn M., Dollé P. Retinoic acid signalling during development. Development. 2012;139:843–858. doi: 10.1242/dev.065938. - DOI - PubMed
    1. Carlberg C. The physiology of vitamin D-far more than calcium and bone. Front. Physiol. 2014;5:335. doi: 10.3389/fphys.2014.00335. - DOI - PMC - PubMed
    1. Chambon P. A decade of molecular biology of retinoic acid receptors. FASEB J. 1996;10:940–954. - PubMed
    1. Kane M. Analysis, occurrence, and function of 9-cis-retinoic acid. Biochim. Biophys. Acta. 2012;1821:10–20. doi: 10.1016/j.bbalip.2011.09.012. - DOI - PubMed
    1. Baker A., McDonnell D., Hughes M., Crisp T., Mangelsdorf D., Haussler M., Pike J., Shine J., O’Malley B. Cloning and expression of full-length cDNA encoding human vitamin D receptor. Proc. Natl. Acad. Sci. USA. 1988;85:3294–3298. doi: 10.1073/pnas.85.10.3294. - DOI - PMC - PubMed

LinkOut - more resources