. 2017 Jul 6;547(7661):94-98.
doi: 10.1038/nature22976. Epub 2017 Jun 21.

Identifying specificity groups in the T cell receptor repertoire

Affiliations

Identifying specificity groups in the T cell receptor repertoire

Jacob Glanville et al. Nature. .

Abstract

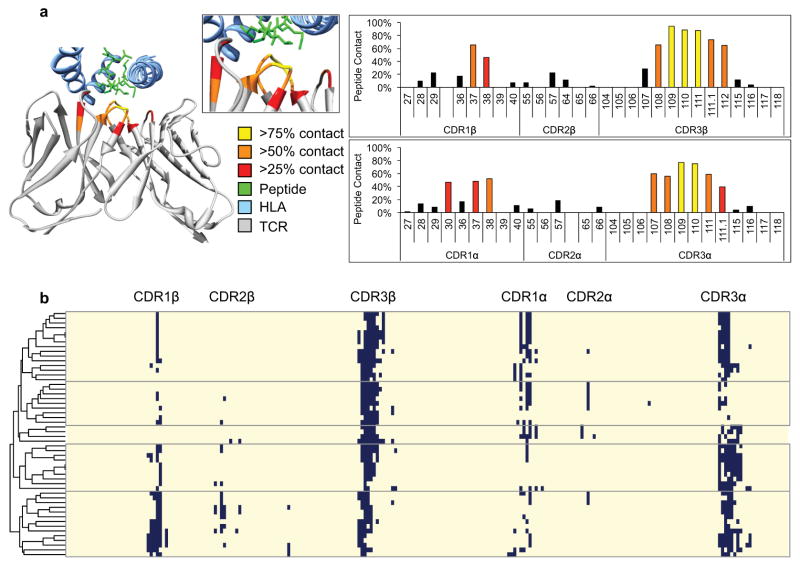
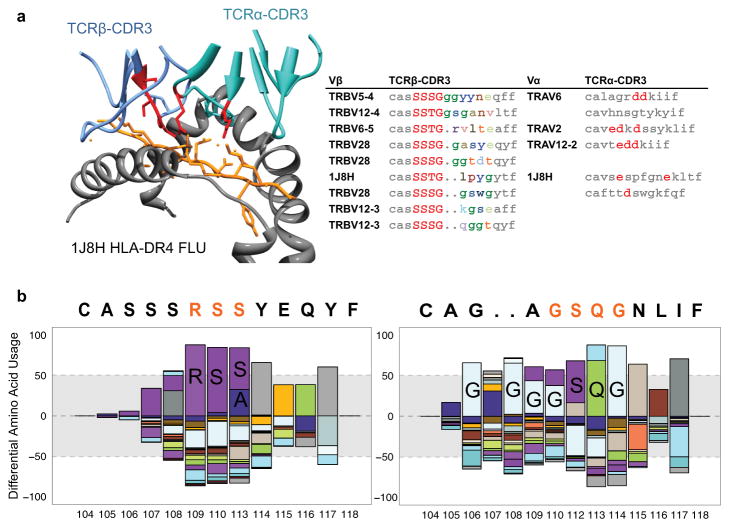
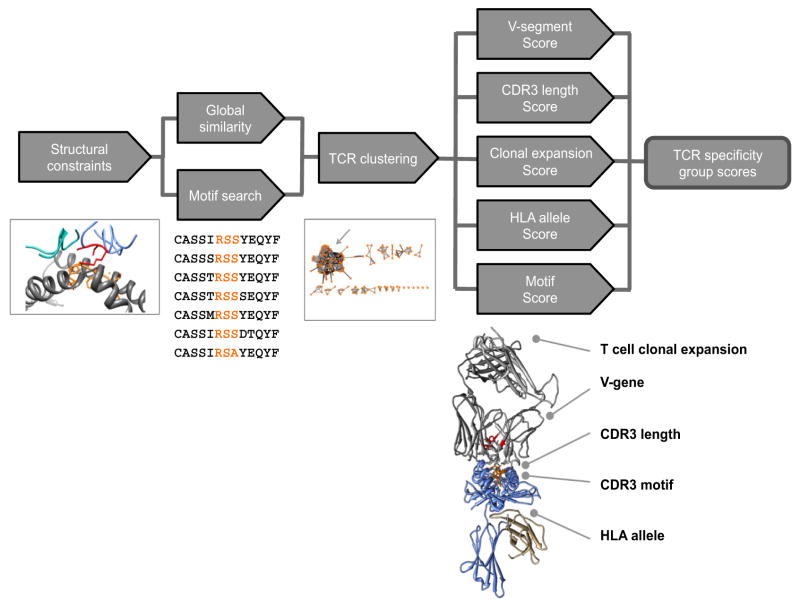
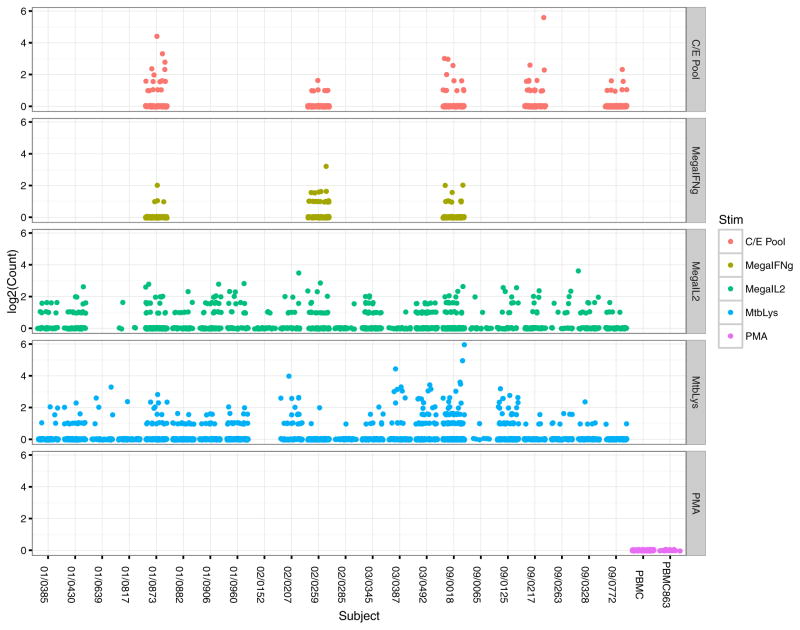
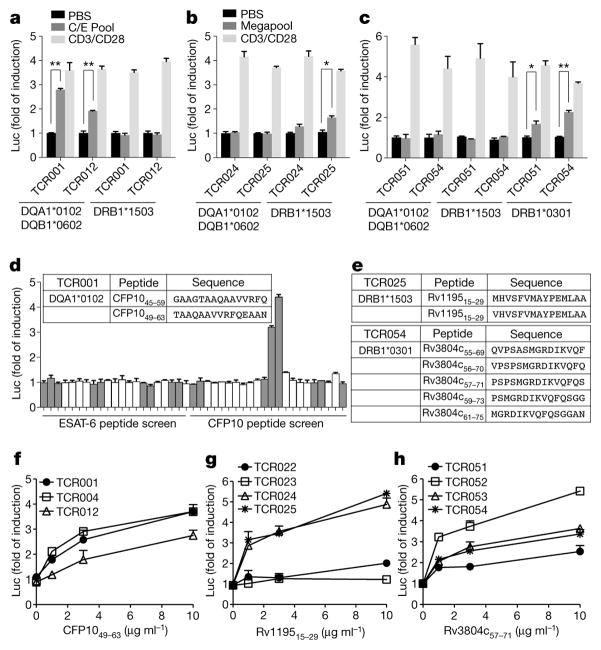
T cell receptor (TCR) sequences are very diverse, with many more possible sequence combinations than T cells in any one individual. Here we define the minimal requirements for TCR antigen specificity, through an analysis of TCR sequences using a panel of peptide and major histocompatibility complex (pMHC)-tetramer-sorted cells and structural data. From this analysis we developed an algorithm that we term GLIPH (grouping of lymphocyte interactions by paratope hotspots) to cluster TCRs with a high probability of sharing specificity owing to both conserved motifs and global similarity of complementarity-determining region 3 (CDR3) sequences. We show that GLIPH can reliably group TCRs of common specificity from different donors, and that conserved CDR3 motifs help to define the TCR clusters that are often contact points with the antigenic peptides. As an independent validation, we analysed 5,711 TCRβ chain sequences from reactive CD4 T cells from 22 individuals with latent Mycobacterium tuberculosis infection. We found 141 TCR specificity groups, including 16 distinct groups containing TCRs from multiple individuals. These TCR groups typically shared HLA alleles, allowing prediction of the likely HLA restriction, and a large number of M. tuberculosis T cell epitopes enabled us to identify pMHC ligands for all five of the groups tested. Mutagenesis and de novo TCR design confirmed that the GLIPH-identified motifs were critical and sufficient for shared-antigen recognition. Thus the GLIPH algorithm can analyse large numbers of TCR sequences and define TCR specificity groups shared by TCRs and individuals, which should greatly accelerate the analysis of T cell responses and expedite the identification of specific ligands.


Conflict of interest statement

The authors declare no competing financial interests.

Figures

Extended Data Figure 1
Extended Data Figure 1. TCRs specific to common antigens show motifs within a limited region of CDR residues with high structural contact propensity
a, Probability of IMGT TCR CDR positions being within 5 Å of peptide antigen, as tabulated from 52 published crystal structures of TCR–pMHC interactions (Supplementary Table 2), and displayed as a heat map on representative TCR 2j8u. Positions with less than 25% contact probability are shown in black. b, Alignment of 52 non-redundant (<95% amino acid identity between any pair) TCR sequences from TCR–pMHC PDB structure complexes. Positions within 5 Å of peptide antigen are indicated in dark blue. Linear set of 3–5 amino acids in CDR3β observed in almost every structure, which TCRβ–CDR3 IMGT positions 108–111 being in contact in 90% of TCR structures. Minimal contacts observed by CDR1 and CDR2 of either chain. TCRs are clustered into five general contact modes according to contact profiles of all six CDRs.
Extended Data Figure 2
Extended Data Figure 2. Crystal structure representative of TCR specificity groups
a, Class II single-cell paired α/β sequencing with crystal structure representative indicating variable CDR3β length and discontinuous role of CDR3α. Discontinuous negatively charged residues in structure 1J8H coordinate lysine-positive charges in peptide; negatively charged residues indicated in orange in alignment when found. b, Positional amino acid bias in flu HLA-A2 dominant motif CDR3β and CDR3α convergence group, normalized by amino acid diversity in the unselected repertoire. Enrichment of RS(S/A) motif in TCRβ compared with naive distribution. Enrichment of SQ at IMGT positions 112, 113 in TCRα, with enrichment of glycine at multiple positions.
Extended Data Figure 3
Extended Data Figure 3. Three-step GLIPH algorithm
GLIPH searches for global and local (motif) CDR3 similarity in TCR CDR regions with high contact probability. Motif significance and global similarity cutoffs are established by repeat random sampling against an unbiased reference pool of TCRs. Second, all identified global and local relationships between TCRs are used to construct clusters of TCR specificity groups. Third, each specificity group is analysed for enrichment of common V-genes, CDR3 lengths, clonal expansions, shared HLA alleles in recipients, motif significance, and cluster size. Enrichment probability is obtained by calculating the probability of obtaining at least the observed Simpson diversity index measure for that feature compared with a random sampling of equal size from the source data set. The resulting features are combined into a specificity group score for each group.
Extended Data Figure 4
Extended Data Figure 4. Benchmark of GLIPH subcomponents and complete algorithm on random naive TCRs or a mixed training set pool of pMHC tetramer+ TCRs of 8 known specificities
a, GLIPH clusters up to 14.5% of tetramer+ TCRs, while clustering less than 0.5% of naive TCRs, a combination of global CDR3 similarity and local motif enrichment resulting in more clustering than either individually. b, The cluster results of applying GLIPH to the mixed pool of tetramer-sorted TCRs. Each node is a TCR, their specificity indicated by colour. Edges between TCRs indicating a GLIPH-predicted shared specificity; light grey indicate shared local motif, and dark grey indicate shared global similarity. Over 95% of cluster members are grouped with other TCRs of the same specificity. c, GLIPH components evaluated for percentage of TCRs clustered versus percentage of correct specificity assignments. Global CDR3 clustering by hamming dist = 1 or dist = 2 are reported. Global CDR3 similarity clustering by CD-HIT, with clustering cutoffs 0.8 or 0.9 reported. Local motif similarity clustering with and without structural constraints reported. Complete GLIPH, including global CDR3 identity, local CDR3 motif similarity, structural constraints and clustering scoring, resulted in 14.5% of TCRs clustering with 95% of cluster members correctly grouped with other TCRs of shared specificity. For global similarity, distance 1 resulted in effective grouping of TCRs whereas distance 2 resulted in predominantly mixed clusters. For local motifs, effective TCR clustering could only be obtained when structural contact probability masks were applied. Similarly, although CD-HIT was not effective at clustering TCRs by common specificity when provided the entire TCR sequences, when offered only the high contact probability CDR3s, it was able to perform effective clusters provided an appropriate clustering threshold. d, When run on replicate A containing TCRs from half of study subjects, GLIPH produced specificity groups whose positional weight matrices (PWMs) could then be used to score the TCRs from replicate B subjects (equations (5) and (6) in Methods). GLIPH scoring identifies new TCRs of correct specificity from new subjects.
Extended Data Figure 5
Extended Data Figure 5. Platform for PBMC stimulation and characterization of antigen-specific TCRs
a, Gating strategy used for isolating and sorting tetramer-positive T cells. b, Frozen PBMCs from QFN+ donors are thawed, recovered and stimulated with either M. tuberculosis lysate or peptide pool. Antigen-specific T cells are single-cell-sorted into 96-well plate for TCR amplification using established protocol. c, Gating strategy used for isolating and single-cell sorting antigen-specific T cells.
Extended Data Figure 6
Extended Data Figure 6. Phenotypic analysis of clonal expanded M. tuberculosis-specific CD4+ T cells
a, Gating strategy for isolating antigen-specific T cells. PBMC from one QFN+ donor (02/0259) was stimulated with M. tuberculosis lysate and then stained with activation markers CD69 and CD154. Antigen-specific CD4+ T cells were sorted by gating on CD69+CD154+ population. Alternatively, PBMCs were stimulated with megapool peptide library. Antigen-specific CD4+ T cells were isolated using cytokine capture assay, IL-2 or IFNγ. b, 18-parameter (parameters listed on right side) phenotypic analysis of M. tuberculosis-specific CD4+ T cells from all the 22 donors. Individual T cells are grouped by TCR sequence; each colour on the bar above the heat maps represents a distinct and clonal expanded TCR sequence. The majority of cells presented a TH1*-like phenotype including IFNγ and IL-2 production, T-bet and RORC expression, as is characteristic of previously reported M. tuberculosis responses.
Extended Data Figure 7
Extended Data Figure 7. Clonal expansion of M. tuberculosis-specific CD4+ T cells
Clonal analysis of M. tuberculosis-specific CD4+ T cells from all the 22 donors using different selection strategy, including stimulation by ESAT6/CFP-10 pool (C/E Pool) or Megapool followed by cytokine capture assay and M. tuberculosis lysate stimulation followed by CD154+ selection. Each dot represents a distinct TCR sequence and the count represents the number of repeat. PMA/ionomycin stimulation was used as a non-specific stimulation control.
Extended Data Figure 8
Extended Data Figure 8. Epitope screen using luciferase assay
a, Each individual peptide from megapool was tested against J76-NFATRE-luc cell expressing TCR025 in co-culture with K562 expressing DRB1*1503. Column 1–300: individual peptide from Megapool, column 301: CD3/CD28 stimulation as positive control. Peptides predicted to be in the top 15 percentile of binding to each HLA by the MHC-II Consensus method are indicated by grey bars. Mean ± s.d. (n = 3, biological replicates) are shown. The insert table shows the restricted HLA type and responding peptides. bd, A similar screen was also performed for TCR054 (b), TCR098 (c) and TCR088 (d).
Extended Data Figure 9
Extended Data Figure 9. Amino acid alignment of naturally occurring and de novo group II TCRs
Amino acid alignment presents first the TCRβ chain followed the TCRα chain for naturally occurring group II natural TCRs n1–n10 from Fig. 5b (n denotes natural) and de novo TCRs De9–De18 from Fig. 5e. All segment identities are reported for each sequence in the sequence headers. Positional conservation is coloured as dark blue if conserved, and light blue or white if variable.
Extended Data Figure 10
Extended Data Figure 10. Comparison of CDR3 length and 3mer motif composition of naive TCR reference set
The naive control data set consists of 162,165 non-redundant V-J-CDR3 sequences from CD45RA+RO naive T cells (labelled with the author name ‘Warren’), 83,910 non-redundant V-J-CDR3 sequences from CD4 naive T cells from 10 healthy controls, and 27,292 non-redundant V-J-CDR3 sequences from CD8 naive T cells from 10 healthy controls, for a total of 268,955 unique naive V-J-CDR3 sequences. a, b, Analysis of CDR3 length distributions (a) and motif frequency distributions (b) indicates that the three naive reference sets have very similar CDR3 length distributions and 3mer amino acid motif frequency distributions (r = 0.99, r = 0.95, and r = 0.94 Pearson correlation coefficients for CD4 × CD8, CD4 × Warren, and CD8 × Warren, respectively).
Figure 1
Figure 1. Characteristics of TCRs reactive to common antigens across individuals
a, MHC–tetramer-sorted antigen-specific TCR repertoires of common pathogen epitopes as well as public sources (n = 2,068). Diversity is calculated as the Shannon entropy of observed clones, where clone counts are the number of individuals expressing each clone. Percentage of all clones that were found in more than one individual reported as public. b, Representative Venn diagram of tetramer EBV-BMLF1280–288-GLC-specific clonal overlap in three HLA-A*0201+/EBV+ donors. c, Minimum Hamming distance of CDR3βs in MHC–tetramer-sorted antigen-specific pools, rendered non-redundant within each subject, compared with equal-sized randomly sampled naive control pools. s.d. of 100 repeat random samples of control TCRs reported on bars (*P < 0.01 Chi-square test). d, CDR3s in MHC–tetramer-sorted antigen-specific pools are enriched for a subset of motifs. Replicates A and B consisting of TCRs from different sets of donors (Supplementary Table 7) reproduce the same motifs with correlated enrichment assessed by Pearson correlation coefficient.
Figure 2
Figure 2. Crystal structure representatives of TCR specificity groups reveal the structural basis for antigen-specific paratope convergence
a, Network analysis of tetramer+ CDR3 clusters indicates relationships between TCRs (nodes) sharing global CDR3 similarity (black edges) or local CDR3 motifs (grey edges: motifs >10 fold enriched, 0.001> probability of enrichment by chance). Grey arrows indicate representative specificity group, accompanied with representative CDR3 alignment and crystal structure. Significant motif residues are highlighted in red in both CDR3 alignments and structure. In alignments: low contact probability, grey. In structures: MHC, grey; peptide, orange; TCRβ, light blue; TCRα, cyan. b, Single-cell paired α/β sequencing with crystal structure representative reveals coordinated motifs in both TCRβ and TCRα CDR3 that define paratope specificity.
Figure 3
Figure 3. TCR specificity groups and predicted HLA-restriction among M. tuberculosis-infected subjects
CDR3 α/β amino acid sequences from five GLIPH TCR specificity groups. Yellow-coloured boxes highlight the predicted common HLA class II alleles for each specificity group (combinatorial sampling probability <0.013 DRB1*15 for group II, probability <0.007 DRB1*03 for group III, probability <0.03 DRB3*03 for group IV, probability <0.02 DRB1*15/DRB5*01 for group V). Green-coloured boxes highlight the TCRs that have been validated in vitro. Red outlines indicate actual HLA as determined by reporter assay.
Figure 4
Figure 4. Identification of common antigen recognition by TCR specificity groups
a, Group I TCRs were tested against candidate HLA alleles using CFP10/ESAT-6 pool (C/E Pool). b, c, Group II (b) and group III (c) TCRs were tested using megapool. Negative control, PBS; positive control, CD3/CD28 stimulation. Mean ± s.d. (n = 3, biological replicates) shown. *P < 0.05 and **P < 0.005 two-tailed Student’s t-tests. d, Individual peptides from C/E Pool tested against TCR001. Top 15th percentile of NetMHC-predicted DQA1*0102 binding indicated by grey bars. Insert table shows identified peptide antigen. e, Restricted HLA types and responding peptides for group II and III TCRs. fh, Dose-dependent response of group I, II and III TCRs to their corresponding epitopes. Mean ± s.d. (n = 3, biological replicates) shown.
Figure 5
Figure 5. Mutagenesis validation and de novo TCR design
a, Glycine scan of CDR3β of TCR025 (group II). Each mutant was stimulated by DRB1*1503-restricted Rv119515–29, as well as a CD3/CD28-positive control. Mean ± s.d. (n = 3, biological replicates) shown. b, Group II CDR3β sequences with common CDR3 length. c, Positional weight matrix (PWM) reports observed CDR3β positional amino acid frequencies from (b). d, Top 1,000 theoretical TCRs and scores from PWM (equation (5) in Methods). Top 10 predicted TCRs (De18–De09) shown in red. Natural TCRs obtained from donors shown in yellow. e, De18–De09 were stimulated by DRB1*1503-restricted Rv119515–29. Blue indicates modified amino acids and red dash line indicates the basal activity. Mean ± s.d. (n = 3, biological replicates) shown. Activity compared to TCR025, *P < 0.01 two-tailed Student’s t-test.

Comment in

References

    1. Arstila TP, et al. A direct estimate of the human αβ T cell receptor diversity. Science. 1999;286:958–961. - PubMed
    1. Davis MM, Bjorkman PJ. T-cell antigen receptor genes and T-cell recognition. Nature. 1988;334:395–402. - PubMed
    1. Qi Q, et al. Diversity and clonal selection in the human T-cell repertoire. Proc Natl Acad Sci USA. 2014;111:13139–13144. - PMC - PubMed
    1. Shortman K, Egerton M, Spangrude GJ, Scollay R. The generation and fate of thymocytes. Semin Immunol. 1990;2:3–12. - PubMed
    1. Rudolph MG, Stanfield RL, Wilson IA. How TCRs bind MHCs, peptides, and coreceptors. Annu Rev Immunol. 2006;24:419–466. - PubMed

Publication types