. 2017 Jul 6;547(7661):89-93.
doi: 10.1038/nature22383. Epub 2017 Jun 21.

Quantifiable predictive features define epitope-specific T cell receptor repertoires

Affiliations

Quantifiable predictive features define epitope-specific T cell receptor repertoires

Pradyot Dash et al. Nature. .

Abstract

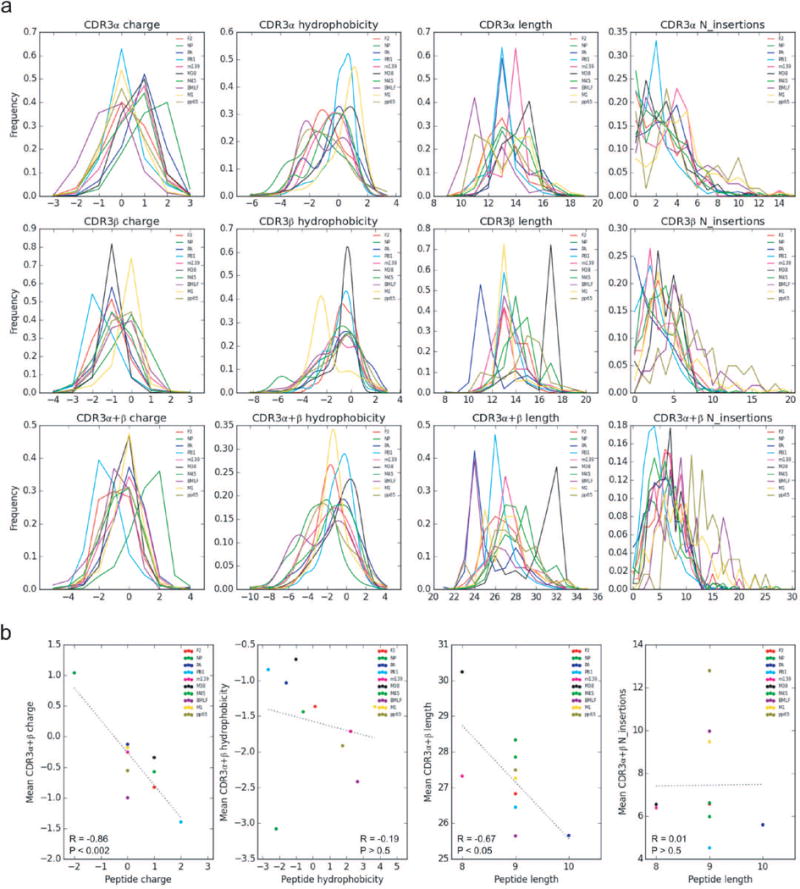
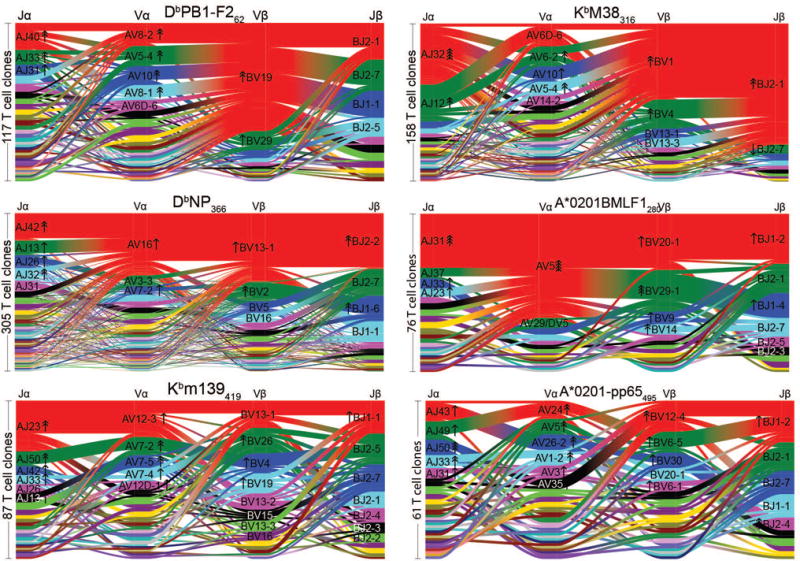
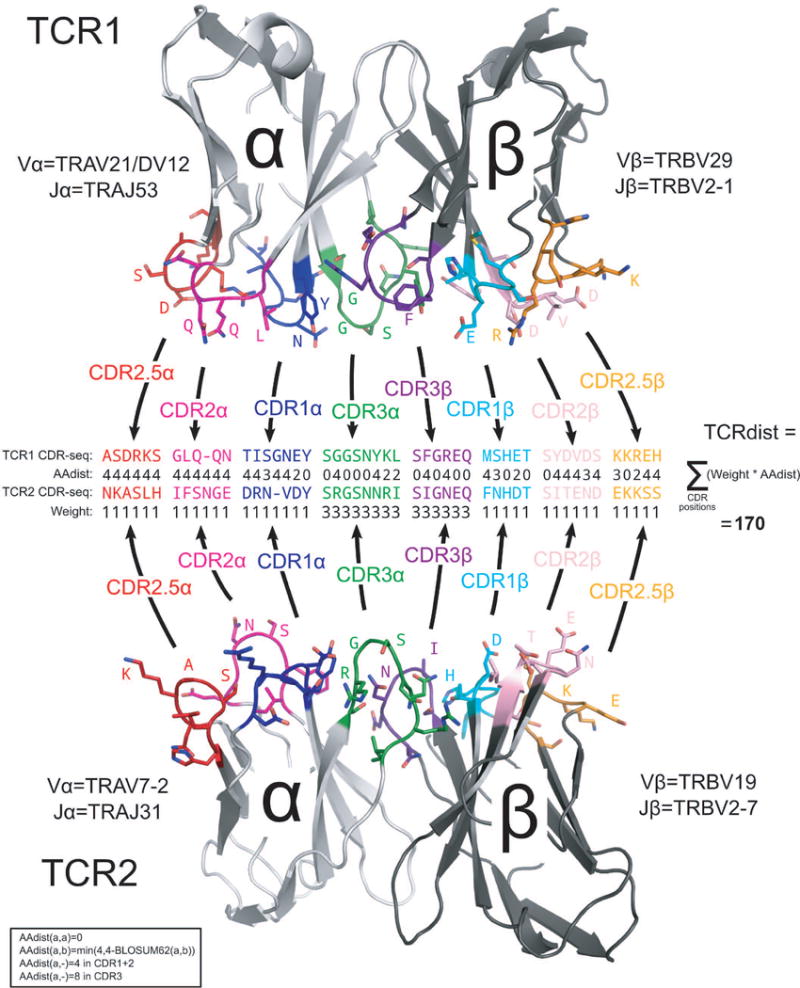
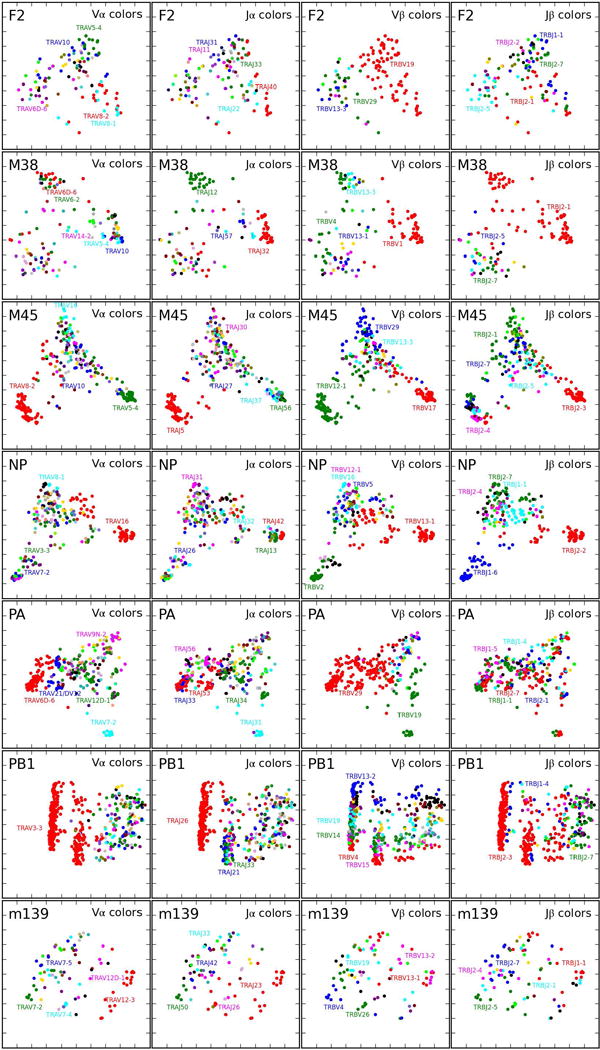
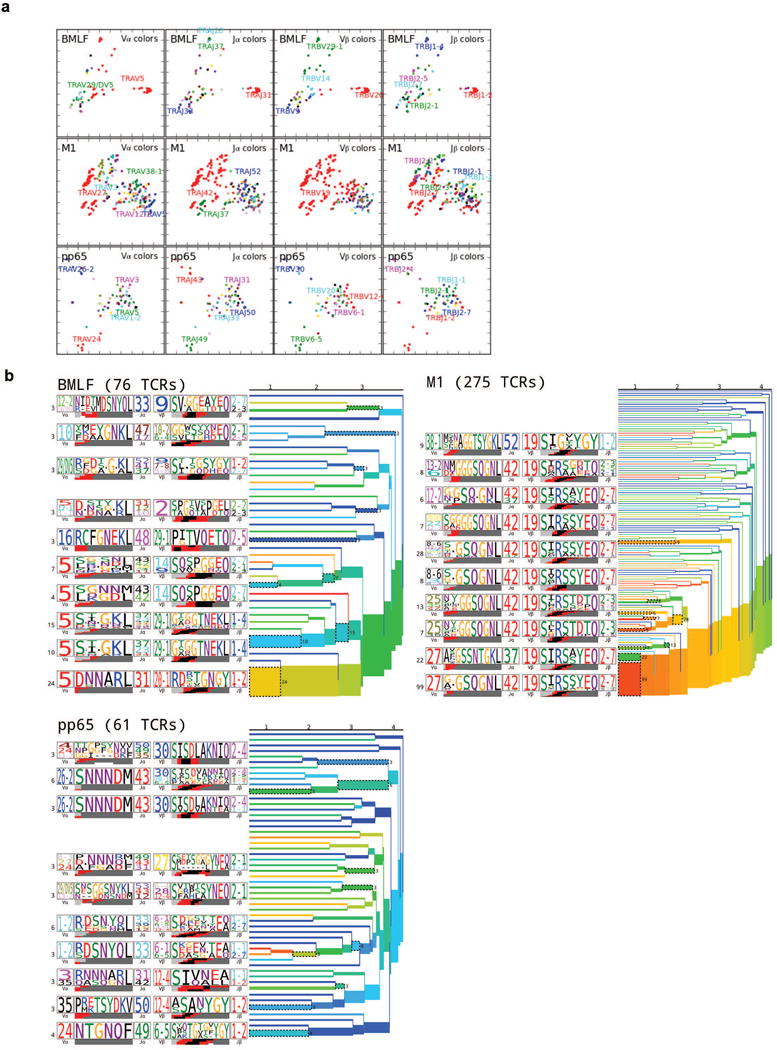
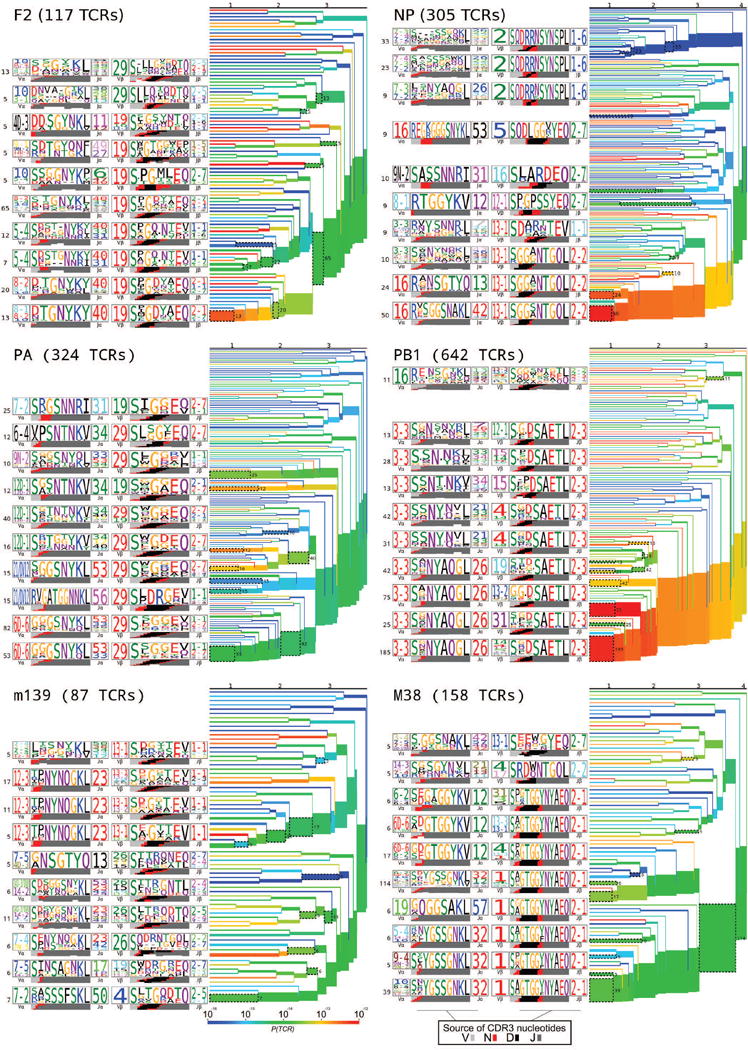
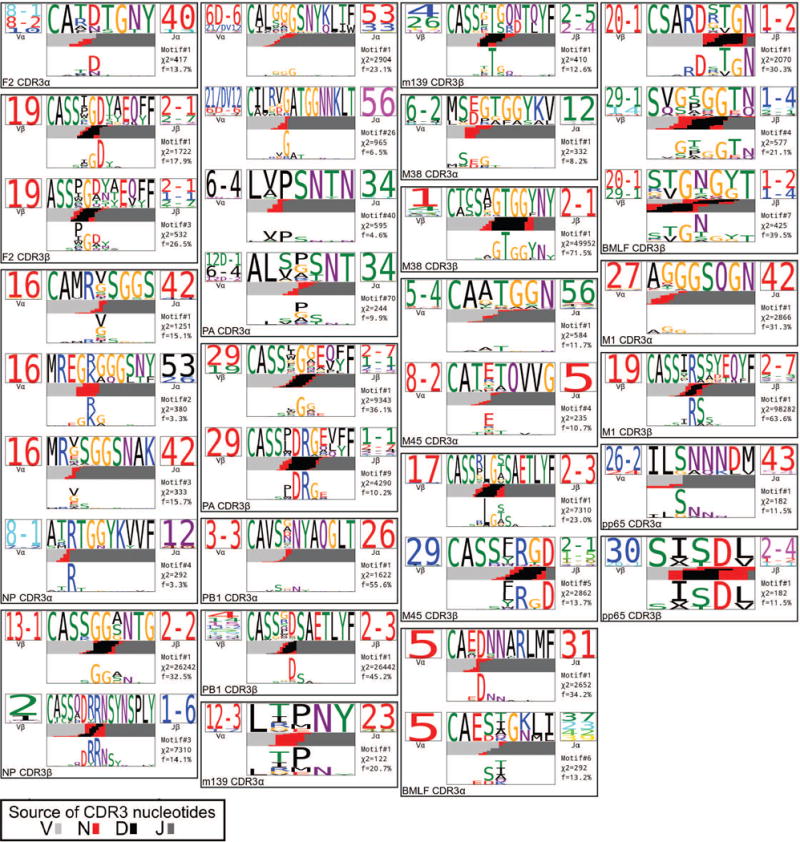
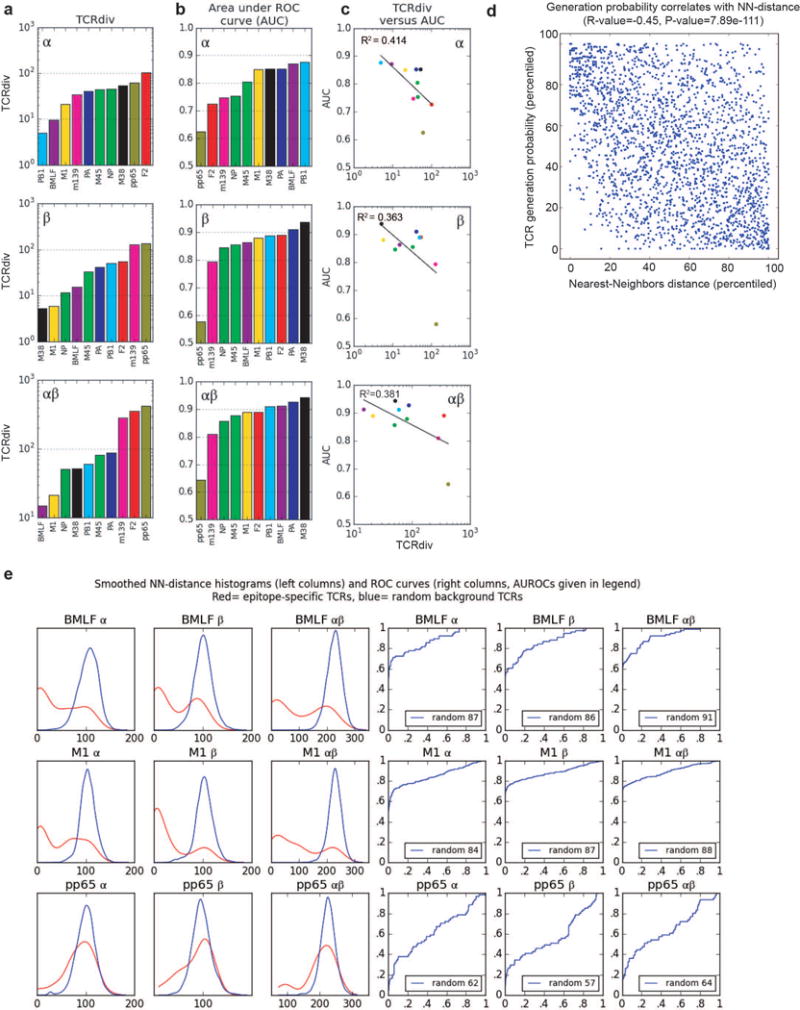
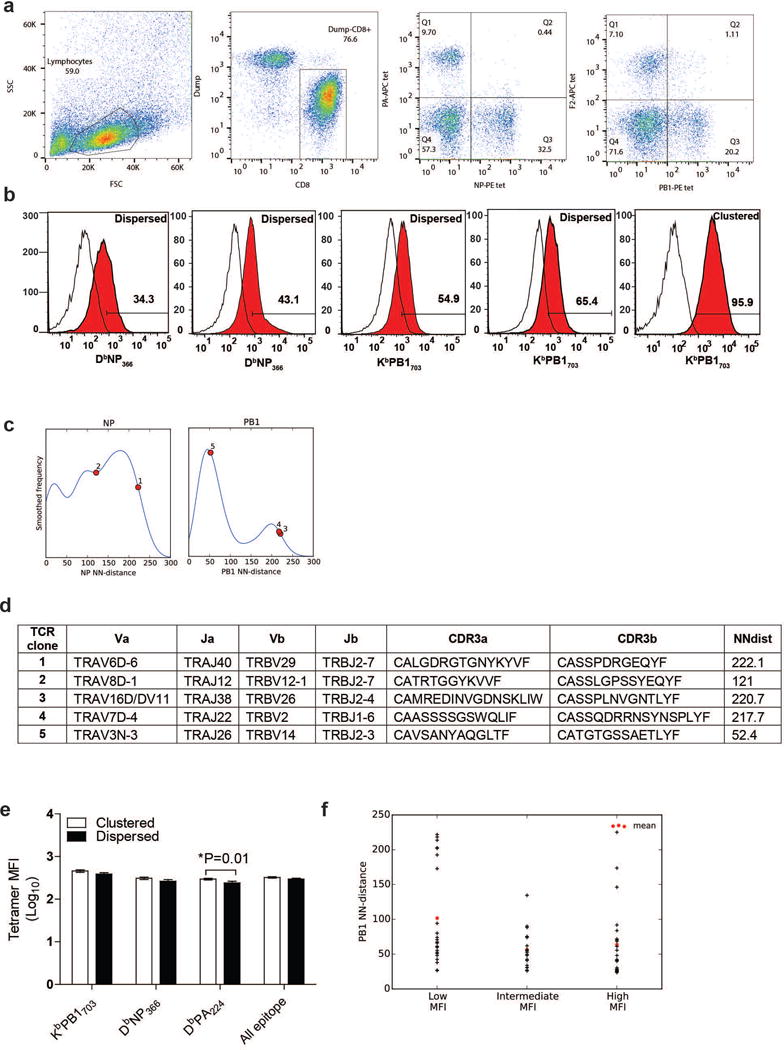
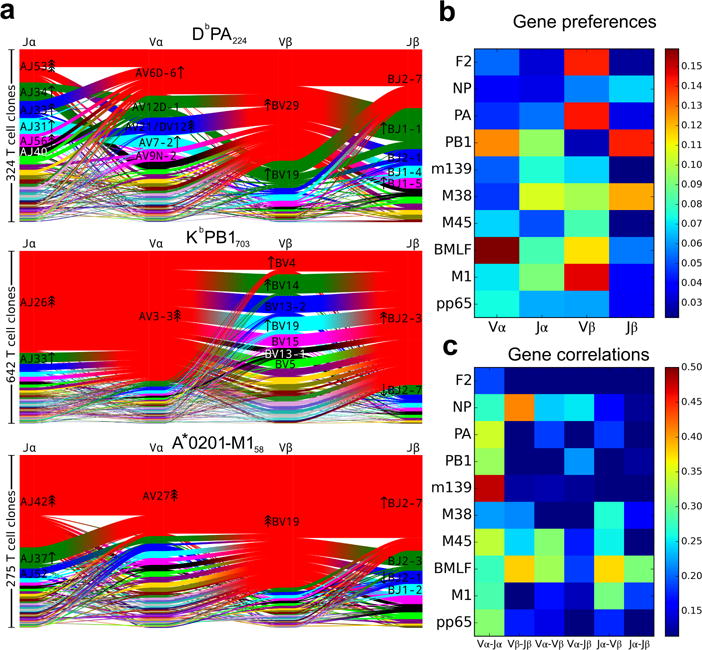
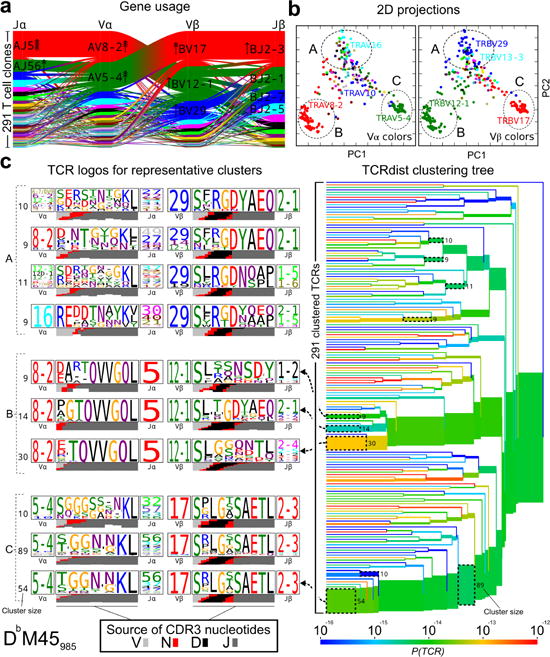
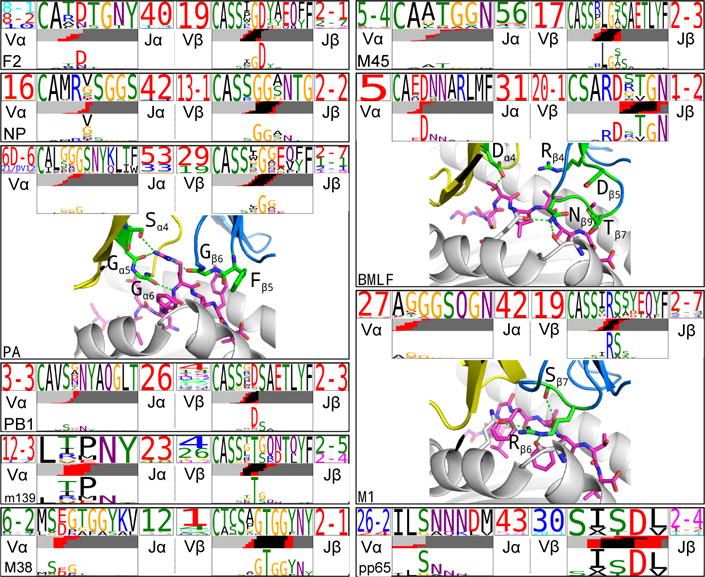
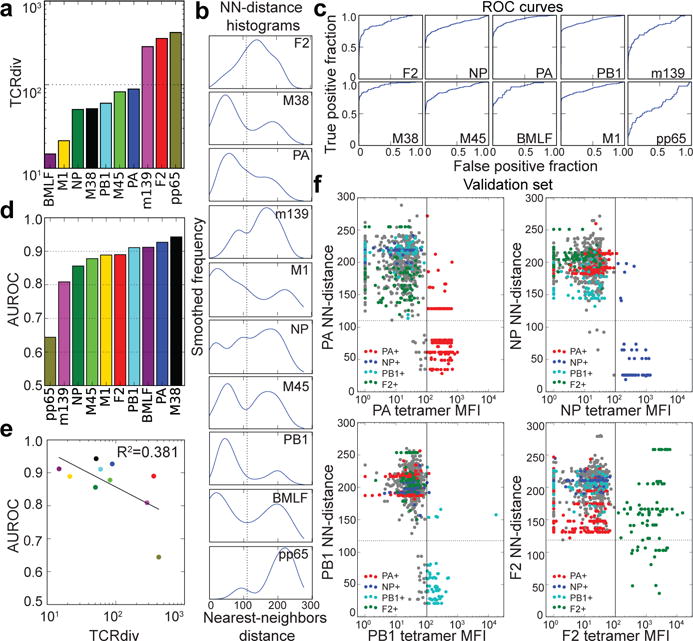
T cells are defined by a heterodimeric surface receptor, the T cell receptor (TCR), that mediates recognition of pathogen-associated epitopes through interactions with peptide and major histocompatibility complexes (pMHCs). TCRs are generated by genomic rearrangement of the germline TCR locus, a process termed V(D)J recombination, that has the potential to generate marked diversity of TCRs (estimated to range from 1015 (ref. 1) to as high as 1061 (ref. 2) possible receptors). Despite this potential diversity, TCRs from T cells that recognize the same pMHC epitope often share conserved sequence features, suggesting that it may be possible to predictively model epitope specificity. Here we report the in-depth characterization of ten epitope-specific TCR repertoires of CD8+ T cells from mice and humans, representing over 4,600 in-frame single-cell-derived TCRαβ sequence pairs from 110 subjects. We developed analytical tools to characterize these epitope-specific repertoires: a distance measure on the space of TCRs that permits clustering and visualization, a robust repertoire diversity metric that accommodates the low number of paired public receptors observed when compared to single-chain analyses, and a distance-based classifier that can assign previously unobserved TCRs to characterized repertoires with robust sensitivity and specificity. Our analyses demonstrate that each epitope-specific repertoire contains a clustered group of receptors that share core sequence similarities, together with a dispersed set of diverse 'outlier' sequences. By identifying shared motifs in core sequences, we were able to highlight key conserved residues driving essential elements of TCR recognition. These analyses provide insights into the generalizable, underlying features of epitope-specific repertoires and adaptive immune recognition.


Conflict of interest statement

Author information

The authors declare no competing financial interests. Readers are welcome to comment on the online version of this article at www.nature.com/nature.

Figures

Extended Data Figure 1
CDR3 region characteristics of 10 epitope-specific TCR repertoires. a, Paired TCR sequences derived from epitope specific CD8+ T cells were analyzed for CDR3 length, charge, hydrophobicity, and inferred number of junctional nucleotide insertions for both single and paired chains as shown in the histograms. Different epitopes are color coded (described in the legend). b, Correlation between CDR3αβ and antigenic peptides for charge, hydrophobicity, length, and N-insertions observed in all 10 epitopes. A summary of the number of subjects, total number of TCR sequences, and unique TCR clones analyzed for each epitope are shown in Extended Data Table 1.
Extended Data Figure 2
V and J gene segment usage and covariation in epitope-specific responses. Gene segment usage and gene-gene pairing landscapes are illustrated graphically using four vertical stacks (one for each V and J segment) connected by curved segments whose thickness is proportional to the number of TCRs with the respective gene pairing (each panel is labeled with the four gene segments atop their respective color stacks and the epitope identifier in the top middle). Genes are colored by frequency within the repertoire with a fixed color sequence used throughout the manuscript which begins red (most frequent), green (second most frequent), blue, cyan, magenta, and black. Clonally expanded TCRs were reduced to a single datapoint for this analysis. The number of clones is indicated to the left of each panel. The enrichment of gene segments relative to background frequencies is indicated by up or down arrows, with each successive arrowhead corresponding to an additional 2-fold deviation (e.g. one arrowhead=2-fold enrichment, two arrowheads=4-fold enrichment).
Extended Data Figure 3
Schematic overview of the TCRdist calculation. Each of the two TCRs being compared is first mapped to the amino acid sequence of its CDR loops (CDR1, CDR2, and CDR3 as well as an additional variable loop here labeled ‘CDR2.5’), as indicated by the black arrows leading from the colored loop regions in the receptor structures to the corresponding amino acid sequences in the middle of the diagram. These CDR sequences are aligned based on the IMGT reference multiple sequence alignments, and a distance score (‘AAdist’) is computed for each position in the alignment using the BLOSUM62 similarity matrix according to the formula given in the box at the bottom left. The AAdist scores are weighted as shown in the ‘Weight’ row (thereby increasing the contribution of the CDR3 regions) and summed to produce the final TCRdist score (shown at the right).
Extended Data Figure 4
Two-dimensional projections of mouse epitope-specific TCR repertoires. Epitope-specific TCR landscapes were projected into two dimensions (2D) using kernel PCA analysis applied to the TCRdist distance matrix: TCRs with small TCRdist values tend to project to nearby points in 2D. The same 2D projection is shown in the four panels of each row, colored by Vα, Jα, Vβ and Jβ gene segment usage (left to right, respectively). The colors are based on gene frequency in the projected repertoire and follow the same sequence used throughout the manuscript: in decreasing order, 1. red, 2. green, 3. blue, 4. cyan, 5. magenta, 6. black, followed by assorted colors for rare frequencies. A summary of number of subjects, total number of TCR sequences and unique TCR clones analyzed for each epitope are shown in Extended Data Table 1.
Extended Data Figure 5
Two-dimensional projections and clustering dendrograms of human epitope-specific TCR repertoires. a, Kernel PCA projections for the three human epitopes, colored as in Extended Data Fig. 4. b, Average-linkage dendrograms of TCR clusterings for the human repertoires. Each clustering was generated using a fixed-distance-threshold algorithm and colored by generation probability (red: highest and blue: lowest probability of ease of TCR recombination). The TCR logos for selected receptor subsets (corresponding to the branches of the dendrogram enclosed in dashed boxes) are shown, labeled by cluster size both to the left of each logo and to the right of the corresponding branches. Each TCR logo depicts the V- and J-gene frequencies, the CDR3 amino acid sequence, and the inferred rearrangement structure of the grouped receptors (colored by source region, light gray for the V-region, dark gray for J, black for D, and red for N-insertions; details in Methods). A summary of number of subjects, total number of TCR sequences and unique TCR clones analyzed for each epitope are shown in Extended Data Table 1.
Extended Data Figure 6
Clustering dendrograms of mouse epitope-specific TCR repertoires. Each mouse epitope-specific TCR repertoire not depicted in main text Fig. 2 was clustered using a fixed-distance-threshold clustering algorithm and represented as a dendrogram colored by generation probability (red: highest and blue: lowest probability of ease of TCR recombination), with TCR logos for selected receptor subsets (corresponding to the branches of the dendrogram enclosed in dashed boxes), labeled by cluster size both to the left of each logo and to the right of the corresponding branches. Each TCR logo depicts the V- and J-gene frequencies, the CDR3 amino acid sequence, and the inferred rearrangement structure of the grouped receptors (colored by source region, light gray for the V-region, dark gray for J, black for D, and red for N-insertions; details in Methods). A summary of number of subjects, total number of TCR sequences and unique TCR clones analyzed for each epitope are shown in Extended Data Table 1.
Extended Data Figure 7
TCR logo representations of CDR3 α and β sequence motifs. The results of our CDR3 motif discovery algorithm were visualized using a TCR logo that summarizes V and J usage, CDR3 amino acid enrichment, and inferred rearrangement structures. The motif sequence logo is shown at full height (top) and scaled (bottom) by per-column relative entropy to background frequencies derived from TCRs with matching gene-segment composition in order to highlight motif positions under selection. The motif chi-squared score (see Methods) and the fraction of the repertoire matched are given below the J-gene logo. A summary of number of subjects, total number of TCR sequences and unique TCR clones analyzed for each epitope are shown in Extended Data Table 1.
Extended Data Figure 8
Quantifying the defining features of epitope-specific populations. a, TCRdiv diversity measures; b, the area under the ROC curves (AUC), a standard measure of classification success; and c, correlations between the discrimination AUC and the TCRdiv diversity measure at single and paired chain level. d, Correlation between repertoire sampling density and generation probability. Nearest-neighbors sampling metric for all TCRs in the dataset (x-axis) is plotted against an estimated generation probability (y-axis) based on a simple model of the rearrangement process that accounts for distance from germ line and convergent recombination. The distributions of each measure were normalized (percentiled by rank) within each dataset so that global differences between repertoires do not influence the correlation. e, Quantifying the defining features of human epitope-specific responses. Smoothed, nearest-neighbor distance distributions with respect to the labeled repertoire are plotted in the left three columns for epitope-specific TCRs (red curves) and randomly selected background TCRs (blue curves); TCRdist distances were calculated over the α chain (column 1), the β chain (column 2), or the full receptor (column 3). Plotted in columns 4–6 are receiver operating characteristic (ROC) curves assessing the performance of neighbor-distance as a TCR classifier, comparing sensitivity and specificity in differentiating epitope-specific receptors from randomly selected background receptors (blue ROC curves). Analyses for both single and paired chains are shown, as indicated in the plot labels. A summary of number of subjects, total number of TCR sequences and unique TCR clones analyzed for each epitope are shown in Extended Data Table 1.
Extended Data Figure 9
Specificity and avidity of TCRs of the dispersed region of the TCRdist dendrograms. a, Representative flow plots showing gating strategies of tetramer positive CD8 T cells from influenza infected lungs. b, Cloning and expression of clustered and dispersed receptors from the indicated epitopes stained with specific tetramer vs. control levels. Representative TCRs from clustered and dispersed region of the TCRdist dendrogram were cloned, expressed, and tested for binding against specific tetramers. Binding of two non-clustered TCRs from NP and PB1 epitope and a TCR from the clustered region of PB1 epitope is shown. c, The distribution of the tested TCRs (numbered 1–5 corresponding to left to right occurrence in (b) on a NN-distance plot and d, their V-J usage, CDR3 sequences with NN-distance score are shown. e, Analysis of the mean fluorescence intensities (MFI) of the clustered and dispersed (separated by visual threshold of 135 NN-distance score) group of receptors shows no consistent segregation of the avidity. Mean and standard error of mean are shown. f, PB1 specific TCRs derived from cells sorted by low, intermediate and high gating show overlapping distribution of NN-distance score [N= 23 (low), 18 (intermediate), 23 (high) cells].
Figure 1
Figure 1
V and J gene segment usage and covariation in epitope-specific responses. a, Gene segment usage and gene-gene pairing landscapes are illustrated using four vertical stacks (one for each V and J segment) connected by curved paths whose thickness is proportional to the number of TCR clones with the respective gene pairing (each panel is labeled with the four gene segments atop their respective color stacks and the epitope identifier in the top middle). Genes are colored by frequency within the repertoire with a fixed color sequence used throughout the manuscript which begins red (most frequent), green (second most frequent), blue, cyan, magenta, and black. The enrichment of gene segments relative to background frequencies is indicated by up or down arrows with arrowhead number equal to the base 2 logarithm of the fold change. b, Jensen-Shannon divergence between the observed gene frequency distributions and background frequencies, normalized by the mean Shannon entropy of the two distributions (higher values reflect stronger gene preferences). c, Adjusted mutual information (AMI) of gene usage correlations between regions (higher values indicate more strongly covarying gene usage). The lower limits of the color ranges in b and c were chosen to highlight significant changes, as described in Methods. A summary of the number of subjects, total number of TCR sequences, and unique TCR clones for each epitope are shown in Extended Data Table 1.
Figure 2
Figure 2
TCRdist analysis of the M45 repertoire identifies clusters of related receptors. a, Gene usage represented as in Figure 1. b, 2D kernel PCA projection of the TCRdist landscape colored by V-alpha (left panel) and V-beta (right panel) gene usage. Three groups of receptors that correspond to TCR logos and clusters depicted in (c) are indicated with dashed ellipses. c, Average-linkage dendrogram of TCRdist receptor clusters colored by generation probability, with TCR logos for selected receptor subsets (the branches enclosed in dashed boxes labeled with size of the TCR clusters). Each logo depicts the V- (left side) and J- (right side) gene frequencies, CDR3 amino acid sequences (middle), and inferred rearrangement structure (bottom bars colored by source region, light gray for the V-region, dark gray for J, black for D, and red for N-insertions) of the grouped receptors. (n=13 mice, 291 TCR clones).
Figure 3
Figure 3
Enriched CDR3 sequence motifs define key features of epitope specificity. The top-scoring CDR3α (left TCR logo) and CDR3β (right TCR logo) sequence motifs are shown for each repertoire. The motif sequence logo is shown at full height (top) and scaled (bottom) by per-column relative entropy to background frequencies derived from TCRs with matching gene-segment composition in order to highlight motif positions under selection. For three epitopes with solved ternary TCR-peptide-MHC structures, the enriched motif positions are mapped onto the 3-D structure: motif positions shown in green sticks; peptide in magenta; alpha (beta) chain in yellow (blue) cartoons; selected hydrogen bonds shown as dotted green lines.
Figure 4
Figure 4
Quantifying the defining features of epitope-specific populations. a, TCRdiv diversity measures and b, smoothed density profiles of the nearest-neighbors (NN) distance are shown for each repertoire. c, Receiver operating characteristic (ROC) curves assess the performance of NN-distance as a TCR classifier, comparing sensitivity and specificity in differentiating epitope-specific receptors from background receptors. d, The area under these ROC curves (AUROC), a standard measure of classification success. e, Correlation between TCRdiv and AUROC. f, Assignment of TCR sequences from influenza infected lungs without prior knowledge of its tetramer specificity by NN-distance classifier. Tetramer binding (mean fluorescence intensity or MFI, x-axis) is plotted against NN-distance score (y-axis) for a validation set of T cell receptors (n=856 TCRs; 352 clones) collected after development of the classifier. The solid vertical lines indicate the MFI thresholds used to define epitope-positive receptors, which are plotted with the colors given in the legend (receptors negative for all four tetramers are shown in gray). Raw MFI values were scaled to align the threshold values across tetramers. Dotted horizontal lines indicating a fixed NN-distance score are provided for visual reference. A summary of the number of subjects, total number of TCR sequences, and unique TCR clones for each epitope are shown in Extended Data Table 1.

Comment in

References

    1. Davis MM, Bjorkman PJ. T-cell antigen receptor genes and T-cell recognition. Nature. 1988;334:395–402. - PubMed
    1. Mora T, Walczak AM. Quantifying lymphocyte receptor diversity. bioRxiv. 2016;046870 doi: 10.1101/046870. - DOI
    1. Giraud M, et al. Fast multiclonal clusterization of V(D)J recombinations from high-throughput sequencing. BMC Genomics. 2014;15:409. - PMC - PubMed
    1. Alamyar E, Giudicelli V, Li S, Duroux P. IMGT/HighV-QUEST the IMGT® web portal for immunoglobulin (IG) or antibody and T cell receptor (TR) analysis from NGS high throughput and deep sequencing. Immunomethods. 2012
    1. Bolotin DA, et al. MiTCR: software for T-cell receptor sequencing data analysis. Nat Methods. 2013;10:813–814. - PubMed

Publication types

MeSH terms

Substances