. 2017 Oct;11(10):1330-1347.
doi: 10.1002/1878-0261.12103. Epub 2017 Aug 11.

Aberrant expression of kallikrein-related peptidase 7 is correlated with human melanoma aggressiveness by stimulating cell migration and invasion

Affiliations

Aberrant expression of kallikrein-related peptidase 7 is correlated with human melanoma aggressiveness by stimulating cell migration and invasion

Tiphaine Delaunay et al. Mol Oncol. 2017 Oct.

Abstract

Members of the tissue kallikrein-related peptidase (KLK) family not only regulate several important physiological functions, but aberrant expression has also been associated with various malignancies. Clinically, KLKs have been suggested as promising biomarkers for diagnosis and prognosis in many types of cancer. As of yet, expression of KLKs and their role in skin cancers are, however, poorly addressed. Malignant melanoma is an aggressive disease associated with poor prognosis. Hence, diagnostic biomarkers to monitor melanoma progression are needed. Herein, we demonstrate that although mRNA of several KLKs are aberrantly expressed in melanoma cell lines, only the KLK7 protein is highly secreted in vitro. In line with these findings, ectopic expression of KLK7 in human melanomas and its absence in benign nevi were demonstrated by immunohistochemistry in vivo. Interestingly, overexpression of KLK7 induced a significant reduction in melanoma cell proliferation and colony formation. Moreover, KLK7 overexpression triggered an increase in cell motility and invasion associated with decreased expression of E-cadherin and an upregulation of MCAM/CD146. Our results demonstrate, for the first time, that aberrant KLK7 expression leads to a switch from proliferative to invasive phenotype, suggesting a potential role of KLK7 in melanoma progression. Thus, we hypothesize that KLK7 may represent a potential biomarker for melanoma progression.

Keywords: E-cadherin; invasion; kallikrein-related peptidase 7; melanoma; migration; proliferation.


Figures

Figure 1
Figure 1
Analysis of the mRNA expression pattern of KLK5, 6, 7, and 14 in different melanoma cell lines by RTPCR. Analysis was performed using RNA isolated from the indicated human melanoma cell lines. mRNA expression of KLK5, 6, 7, and 14 was characterized by semiquantitative PCR as described in the Materials and methods section.*Normal human embryonic melanocytes (NHEM), used as negative control; **human keratinocyte‐like HaCaT cells, used as positive control; and GADPH as internal control.
Figure 2
Figure 2
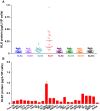
Quantification of the antigen levels of various KLKs in the cell culture supernatants of human melanoma cell lines by ELISA. (A) Secretion of KLK 4, 5, 6, 7, 8, 10, 13, and 14 in conditioned medium from 23 melanoma cell lines was assessed by ELISA and is presented in a scatter plot. Protein values represent the mean concentration of KLKs (μg·L−1) secreted by 106 cells, which were cultured for 24 h. (B) Conditioned medium was collected from 23 melanoma cell lines and KLK7 concentration assessed by ELISA. Protein values represent the mean concentration of KLK7 (μg·L−1) secreted by 106 cells, which were cultured for 24 h. Note that normal melanocytes (NHEM cells) express very low, if any, KLK7.
Figure 3
Figure 3
Detection of KLK7 on formalin‐fixed, paraffin‐embedded sections of primary and metastatic melanomas by immunohistochemistry. (A) Representative images of the KLK7 expression pattern in human melanocytic lesions obtained by immunohistochemical staining. (a) Nevi with negative staining (intensity: 0); (b, c) primary melanoma with weak KLK7 staining (intensity: +1); (d, f) metastatic melanoma with moderate to strong KLK7 staining (intensity: +2 and +3); (e) primary melanoma with strong KLK7 staining (intensity: +3). Note that there is no staining in the nevi, but a significantly increased staining in primary (PM) and metastatic melanoma (MM). Immunohistochemical staining generally exhibits a heterogeneous cytoplasmic KLK7 expression regardless of the stage (compare b, c, and e versus d and f). As expected, normal‐appearing epidermal cell layers adjacent to nevi (a) or to primary melanoma (b) show the highest KLK7 levels in the stratum corneum layers (white stars) (Yousef et al., 2000). Black arrows in (b), (d), (e), and (f) point to positive KLK7 immunoreactivity in the cytoplasmic compartment of the cells. The gray arrow in (a) points to a normal melanocyte with negative staining. Black stars in (c) indicate KLK7 staining in the vessels. Scale bar = 200 μm. (B) Staining intensity of KLK 7 was categorized into intensity ranges from 0 to 3+. The average percentage of cells in each group was determined and is shown in a stacked graph for each tissue type (n = 38). N, nevi; PM, primary melanoma; MM, metastatic melanoma.
Figure 4
Figure 4
KLK7 triggers ERK1/2 phosphorylation in melanoma cells. (A) Immunoblot detection of phosphorylated ERK1/2 (upper panel) in quiescent MeWo cell lysates treated with or without KLK7 (10 nm) for the indicated time periods. To confirm equal protein loading, the membranes were stripped and incubated with an antibody detecting both nonphosphorylated and phosphorylated ERK1/2 (lower panel). Results are representative of two separate experiments. (B) Dose‐dependent activation of ERK1/2 phosphorylation by KLK7. Quiescent MeWo cells were stimulated with the indicated concentrations of KLK7 for 10 min. The upper panel shows the result obtained with an antibody specifically directed to phosphorylated ERK1/2, and the lower panel the result using an antibody detecting both nonphosphorylated and phosphorylated ERK1/2. Results are representative of two separate experiments.
Figure 5
Figure 5
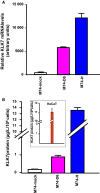
Quantification of KLK7 mRNA and measurement of KLK7 protein secretion in melanoma M74‐derived cell lines. Melanoma M74 cells were stably transfected with the KLK7 expression plasmid pRcRSVKLK7 or with the pRcRSV vector alone. M74‐D6 represents a selected clone overexpressing KLK7, and M74‐H is a batch‐transfected M74‐derived KLK7‐overexpressing cell line. M74‐mock, M74 cells, stably transfected with the empty vector only. (A) Total RNA from either M74‐D6, M74‐H, or M74‐mock cells was reverse‐transcribed and subsequently analyzed by SYBR Green fluorescence‐based QPCR to quantify the KLK7 mRNA expression levels. GAPDH was used as the endogenous reference gene for normalization of KLK7 expression. (B) Conditioned medium was collected from either M74‐D6, M74‐H, or M74‐mock cells after 24 h, and KLK7 antigen levels were assessed by ELISA. The inset depicts the KLK7 antigen levels measured in cell culture supernatants of HaCaT cells. Data represent the mean protein values ± SEM of three independent experiments.
Figure 6
Figure 6
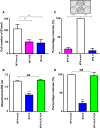
Overexpression of wild‐type KLK7, but not the active site mutant KLK7‐S/A, inhibits cell growth and colony formation in melanoma cells. (A) M74‐D6, M74‐H, and M74‐mock cells were seeded as described in Materials and methods and counted after 96 h. Data are given as mean ± SEM of three independent experiments. **< 0.01, M74‐D6 and M74‐H cells versus M74‐mock cells. (B) M74‐cells overexpressing wild‐type KLK7 (M74‐H), or its active site mutant (M74‐KLK7‐S/A), or M74‐vector cells (M74‐mock) were seeded as described in Materials and methods, and proliferation was analyzed after 72 h using the WST‐1 Cell Proliferation Assay Kit. Data are given as mean ± SEM of three independent experiments. M74‐H versus M74‐mock, ***< 0.001; M74‐KLK7‐S/A versus M74‐mock, NS (P > 0.05). (C) M74‐D6, M74‐H, and M74‐mock cells were plated as described in Materials and methods and incubated for 2 weeks. KLK7 induced a strong decrease in melanoma colony formation. Representative images (upper panel) were captured and quantified (lower panel) with an Image Quant™ LAS 4000 digital imaging system. Columns represent the mean percentage of colonies ± SEM of three independent experiments, each performed in duplicate. ***P < 0.001. (D) M74‐cells overexpressing wild‐type KLK7 (M74‐H), or its active site mutant (M74‐KLK7‐S/A), or M74‐vector cells (M74‐mock) were plated as in (C). Columns represent the mean percentage of colonies ± SEM of three independent experiments, each performed in duplicate. M74‐H versus M74‐mock, ***< 0.001; M74‐KLK7‐S/A versus M74‐mock, NS (P > 0.05).
Figure 7
Figure 7
KLK7 overexpression in M74 cells results in altered cell morphology and modulates expression of cell adhesion molecules. (A) Representative phase‐contrast images of KLK7‐overexpressing cells: both the clonal M74‐D6 and the batch‐transfected M74‐H KLK7 overexpressing cell lines reveal an altered cell morphology compared with M74‐mock vector control cells. Cells overexpressing KLK7 display a spindle‐shaped morphology with membrane protrusions. Scale bar = 50 μm. (B) Representative immunofluorescence images (green) show a strong decrease in E‐cadherin (upper panel) and increase in MCAM/CD146 (lower panel) staining in KLK7‐overexpressing M74‐D6 and M74‐H cells compared to M74‐mock cells. Nuclear staining was performed with DAPI (blue). Scale bar = 100 μm.
Figure 8
Figure 8
KLK7 overexpression but not KLK7 mutant induces melanoma cell migration and invasion. (A) M74‐D6, M74‐H, and M74‐mock cells were plated on 8‐μm pore‐size Transwell® inserts. After 24 h, cells were stained with crystal violet/methanol and migrating cells were counted using an optical imaging system. Migrated cells from six filter fields were calculated with the image j software. **< 0.01; ***< 0.001. (B) M74‐cells overexpressing wild‐type KLK7 (M74‐H), its active site mutant (M74‐KLK7‐S/A), or M74‐vector cells (M74‐mock) were plated and analyzed as described in (A). M74‐H versus M74‐mock, ***< 0.001; M74‐KLK7‐S/A versus M74‐mock. NS (P > 0.05). (C) Transwell invasion assay: M74‐D6, M74‐H, and M74‐mock cells were plated on 8‐μm pore‐size Transwell® inserts precoated with 10 μg of Matrigel™ (5 × 104 per well) and invasion of the cells analyzed as described in (A). ***P < 0.001.

Similar articles

Cited by

References

    1. French Public Health Code: Bioethical Law 2004‐800 of August 6, 2004 on bioethics. Journal official 182, Art. L. 1232‐1, Art. L. 1235‐2, Art. L. 1245‐2.
    1. Borgono CA and Diamandis EP (2004) The emerging roles of human tissue kallikreins in cancer. Nat Rev Cancer 4, 876–890. - PubMed
    1. Caubet C, Jonca N, Brattsand M, Guerrin M, Bernard D, Schmidt R, Egelrud T, Simon M, Serre G (2004) Degradation of corneodesmosome proteins by two serine proteases of the kallikrein family, SCTE/KLK5/hK5 and SCCE/KLK7/hK7. J Invest Dermatol. 122, 1235–1244. - PubMed
    1. Chung H, Hamza M, Oikonomopoulou K, Gratio V, Saifeddine M, Virca GD, Diamandis EP, Hollenberg MD, Darmoul D (2012) Kallikrein‐related peptidase signaling in colon carcinoma cells: targeting proteinase‐activated receptors. Biol Chem 393, 413–420. - PubMed
    1. Darmoul D, Gratio V, Devaud H, Lehy T and Laburthe M (2003) Aberrant expression and activation of the thrombin receptor protease‐activated receptor‐1 induces cell proliferation and motility in human colon cancer cells. Am J Pathol 162, 1503–1513. - PMC - PubMed

Publication types