. 2017 Jun 20;19(12):2503-2514.
doi: 10.1016/j.celrep.2017.05.082.

The Super-Enhancer-Derived alncRNA-EC7/Bloodlinc Potentiates Red Blood Cell Development in trans

Affiliations

The Super-Enhancer-Derived alncRNA-EC7/Bloodlinc Potentiates Red Blood Cell Development in trans

Juan R Alvarez-Dominguez et al. Cell Rep. .

Abstract

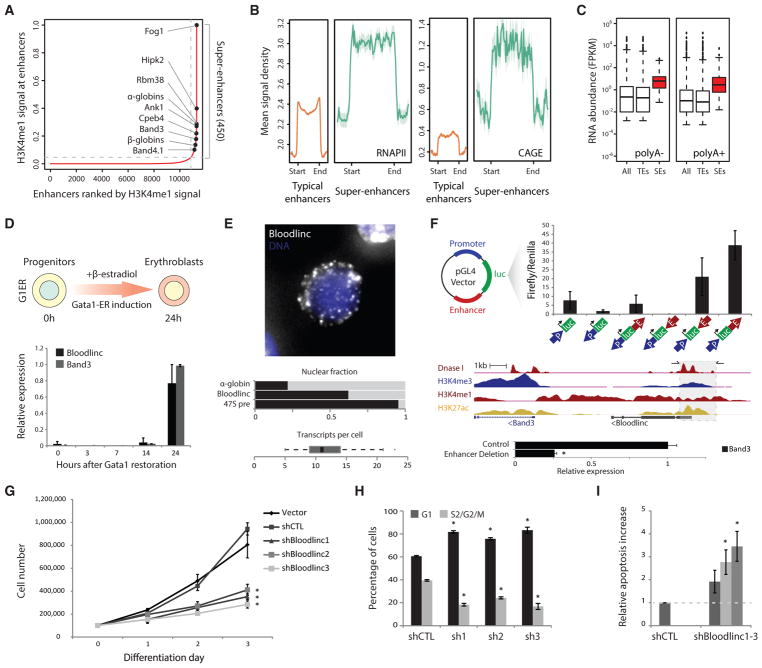
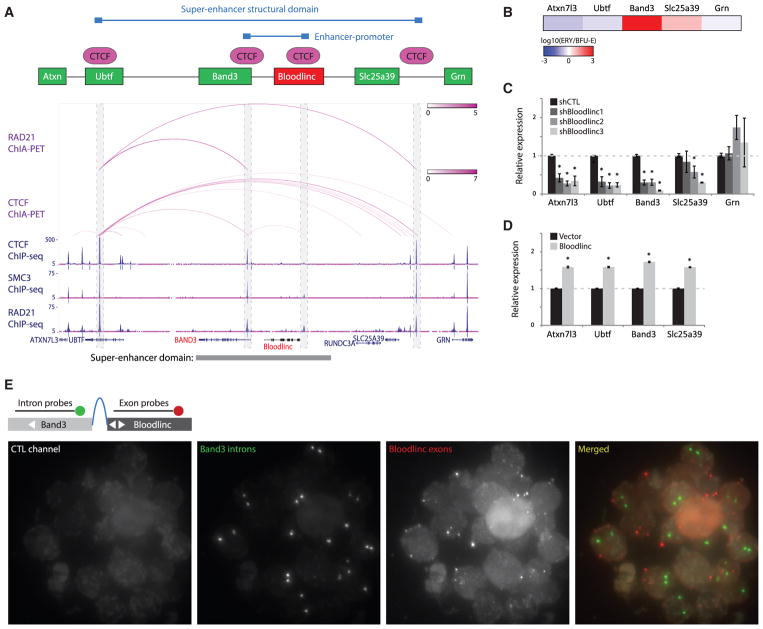
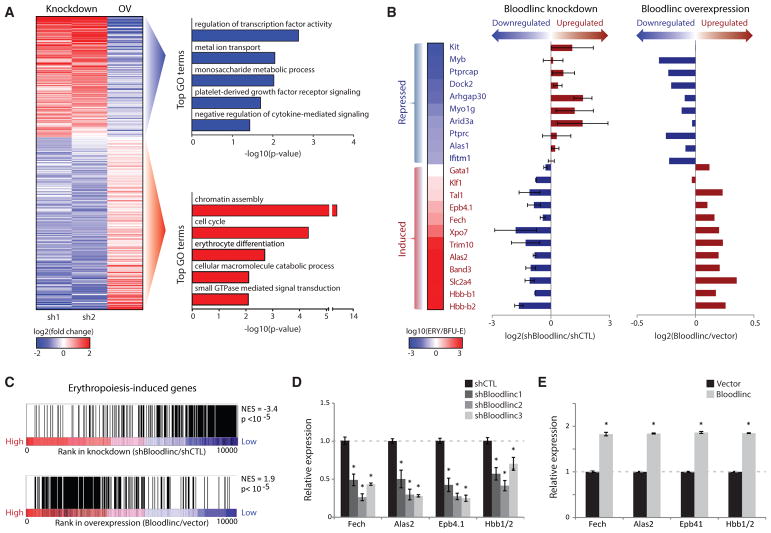
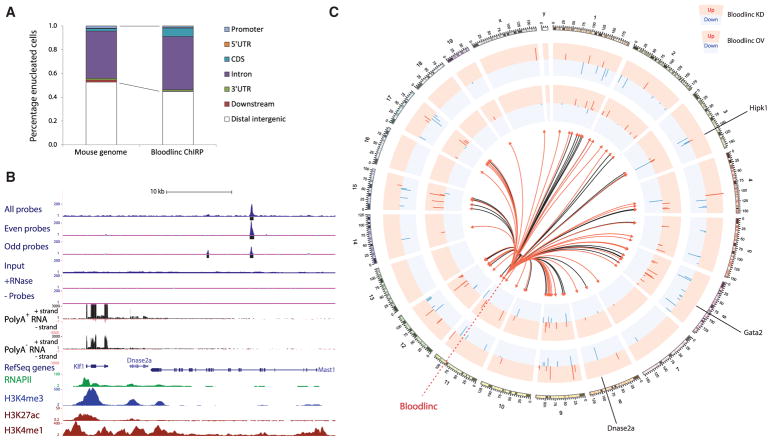
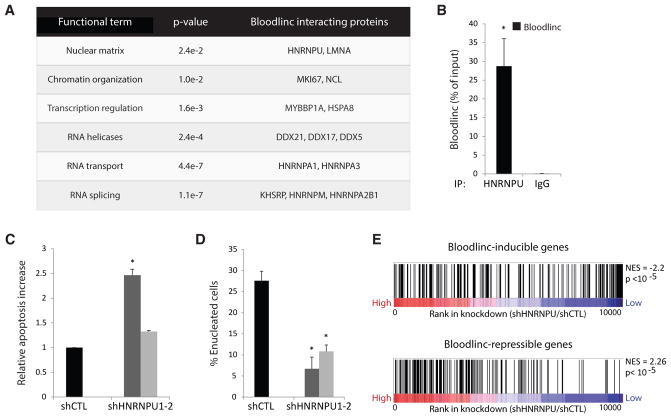
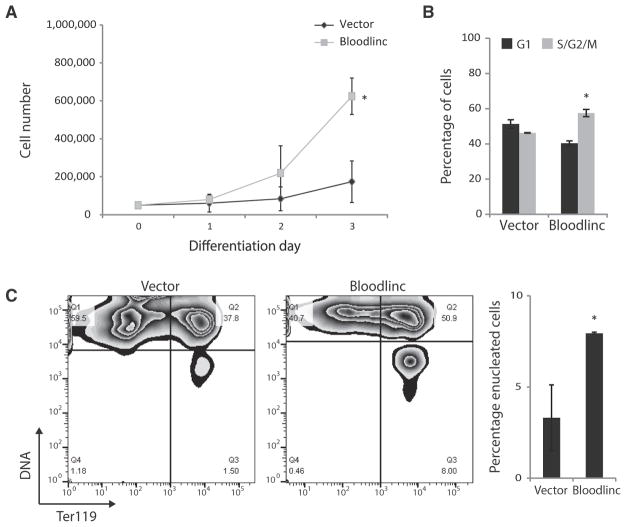
Enhancer-derived RNAs are thought to act locally by contributing to their parent enhancer function. Whether large domains of clustered enhancers (super-enhancers) also produce cis-acting RNAs, however, remains unclear. Unlike typical enhancers, super-enhancers form large spans of robustly transcribed chromatin, amassing capped and polyadenylated RNAs that are sufficiently abundant to sustain trans functions. Here, we show that one such RNA, alncRNA-EC7/Bloodlinc, is transcribed from a super-enhancer of the erythroid membrane transporter SLC4A1/BAND3 but diffuses beyond this site. Bloodlinc localizes to trans-chromosomal loci encoding critical regulators and effectors of terminal erythropoiesis and directly binds chromatin-organizing and transcription factors, including the chromatin attachment factor HNRNPU. Inhibiting Bloodlinc or Hnrnpu compromises the terminal erythropoiesis gene program, blocking red cell production, whereas expressing Bloodlinc ectopically stimulates this program and can promote erythroblast proliferation and enucleation in the absence of differentiation stimuli. Thus, Bloodlinc is a trans-acting super-enhancer RNA that potentiates red blood cell development.

Keywords: enhancer RNA; erythropoiesis; long non-coding RNA; red blood cell; super-enhancer.


Figures

Figure 1
Figure 1. Bloodlinc Is Transcribed from a Band3 Super-Enhancer and Is Required for Survival and Proliferation of Differentiating Erythroblasts
(A) The distribution of normalized H3K4me1 signal enrichment across erythroid enhancer domains reveals a subset with exponentially higher levels than the rest, comprising 450 super-enhancers (SEs). Erythroid-important genes associated with SEs are highlighted. (B) Erythroid super-enhancers are more highly transcribed than typical enhancer domains. Metagene plots show mean RNA polymerase II and CAGE signal density across typical- and super-enhancer domains ± 2.5 kb flanking regions. (C) Erythroid super-enhancers accumulate more RNA than typical enhancer domains. Boxplots show poly(A) and poly(A)+ RNA abundance (fragments per kilobase of transcript per million mapped reads [FPKM]) for all enhancers, typical enhancers (TEs), and super-enhancers (SEs). (D) Bloodlinc and Band3 show concordant and late-stage activation upon restoration of GATA1 by β-estradiol treatment of G1ER cells. Data are mean ± 95% confidence interval. (E) Bloodlinc is a diffuse, pancellular RNA in late-stage erythroblasts. Top: maximum z stack projection of RNA FISH fluorescence microscopy image. Middle: proportion of Bloodlinc transcripts in the nucleus, compared with α-globin and 47S pre-rRNA. Bottom: distribution of per-cell Bloodlinc transcript counts across n = 65 cells with more than zero transcripts. (F) Bloodlinc’s templating enhancer is necessary and sufficient for high-level Band3 erythroid expression in vivo. Top: enhancer reporter assays in MEL cells evidence orientation-independent enhancer function. Middle: strategy for enhancer deletion (shaded area) using flanking CRISPR/Cas9 single-guide RNAs (sgRNAs), with their location shown by horizontal arrows at the top. Bottom: Band3 high-level induction is abolished in sgRNA-transduced MEL cells. Data are mean ± SEM from n = 3 replicate measurements. (G) Bloodlinc inhibition blocks proliferation during terminal erythroid differentiation. Shown are live cell numbers in ex vivo-differentiated erythroid cultures transduced with empty vector, non-targeting shRNA, or Bloodlinc-targeting shRNAs. Data are mean ± SEM from n = 3 experiments with n = 1 or 2 replicate measurements each. (H) Bloodlinc KD cells accumulate in G1 phase after 24 hr of ex vivo differentiation. Data are mean ± SEM from n = 3 experiments. (I) Elevated apoptosis of Bloodlinc KD cells after 24 hr of ex vivo differentiation. Data are mean ± SEM from n = 3 experiments. *p < 0.05 relative to control, t test. See also Figures S1–S3 and Table S1.
Figure 2
Figure 2. Bloodlinc Is Not Confined to Its Parent Super-Enhancer Domain
(A) Bloodlinc’s templating SE is located within an insulated structural domain. Interacting sites of the CTCF insulator co-bound by cohesin delimit the SE domain (model shown on top of tracks). Tracks display RAD21 and CTCF ChIA-PET interactions (purple arcs) and RAD21, SMC3, and CTCF chromatin immunoprecipitation sequencing (ChIP-seq) signal (blue density maps) in K562 cells. Gene models are depicted in blue, and the SE is highlighted at the bottom. Outer boxes highlight the limits of the SE domain, and inner boxes highlight interacting sites between Bloodlinc and the Band3 promoter. (B) Band3 is the only gene within or flanking the SE domain with high-level induction between BFU-Es and TER119+ erythroblasts (ERY). (C) Inhibiting Bloodlinc in ex vivo-differentiated erythroid precursors downregulates mRNA levels of genes within and outside the SE domain. Data are mean ± SEM from n = 2 experiments with n = 3 replicate measurements each. *p < 0.05 relative to control, t test. (D) Overexpressing Bloodlinc in ex vivo-differentiated erythroid precursors upregulates mRNA levels of genes within and outside the SE domain. Data are mean ± SEM from n = 2 experiments with n = 3 replicate measurements each. *p < 0.05 relative to control, t test. (E) Bloodlinc diffuses beyond its enhancer-promoter DNA loop of origin. Panels show maximum zstack projections of RNA FISH fluorescence microscopy images labeling Bloodlinc exons (red) and Band3 introns (green) in mixed-stage erythroblasts. Control channel measures background fluorescence. See also Figure S4.
Figure 3
Figure 3. Bloodlinc Modulates the Core Gene Program of Terminal Erythropoiesis
(A) Left: expression change (log2 fold change over control) of 488 genes differentially and reciprocally regulated upon Bloodlinc shRNA-mediated inhibition or ectopic overexpression (OV) after 24 hr of ex vivo differentiation. Right: top non-redundant gene ontology (GO) biological processes enriched among reciprocally regulated genes. (B) Bloodlinc modulation impacts erythropoiesis-repressed (top) and erythropoiesis-induced genes (bottom). Expression changes for select genes (left) during normal differentiation is shown as the log10 expression ratio between BFU-Es and TER119+ erythroblasts (ERY). Their expression changes upon Bloodlinc depletion or overexpression (right) are shown as the log2 expression ratio between treated versus control cells. Depletion data are pooled from two separate shRNAs. (C) Erythropoiesis-induced genes are Bloodlinc-inducible. Gene set enrichment analysis of genes induced in erythroblasts versus progenitors (Alvarez-Dominguez et al., 2014) in Bloodlinc-depleted versus Bloodlinc-overexpressing cells. NES, normalized enrichment score. (D and E) qPCR detection of erythroid markers reciprocally regulated in Bloodlinc-depleted (D) versus Bloodlinc-overexpressing (E) cells. Data are mean ± SEM from n = 2 experiments with n = 3 replicate measurements each. *p < 0.05 relative to control, t test. See also Figure S5 and Table S2.
Figure 4
Figure 4. Bloodlinc Localizes to trans-Chromosomal Loci Encoding Key Erythropoiesis Modulators
(A) Bloodlinc genomic occupancy is enriched in genic regions. (B) Bloodlinc occupancy is focal, specific, and can occur within regulatory regions distal to erythroid-active genes, such as the Klf1/Dnase2a locus. Top tracks display signal density for Bloodlinc ChIRP-seq with all probes or with split probe pools, as well as input, RNase-treated, and no probe controls. Bottom tracks display strand-specific maps of poly(A)+ RNA and poly(A) RNA signal density, and occupancy maps of RNA polymerase II, H3K4me3, H3K4me1, and H3K27ac. Gene models are depicted in blue. (C) Bloodlinc diffuses from its transcription site to trans-chromosomal gene targets that are reciprocally regulated upon Bloodlinc knockdown and overexpression. Tracks show expression changes (log2 fold change over control) of 81 genes differentially and reciprocally regulated upon Bloodlinc shRNA-mediated knockdown (KD; outer tracks) or ectopic overexpression (OV; inner tracks), inscribed at their respective genomic locales. Depletion data are pooled from two separate shRNAs. The center of the circle depicts Bloodlinc diffusion to its ChIRP-seq occupancy sites as directional links from its genomic locus. Links to occupancy sites intersecting genic regions are highlighted in red. See also Figure S6 and Table S3.
Figure 5
Figure 5. Bloodlinc Interacts with Chromatin-Organizing and Transcription Factors
(A) Bloodlinc high-confidence interactors enrich for specific functional classes (p < 0.05, Fisher’s exact test); select members of each class are listed to the right (see Table S4 for full list of interactors with peptide counts). (B) Bloodlinc specifically and strongly interacts with HNRNPU. Bloodlinc retrieval was assayed by qPCR in immunoprecipitates of endogenous HNRNPU from MEL cells and compared with IgG control. Data are mean ± SEM from n = 5 experiments with n = 3 replicate measurements each. (C) Elevated apoptosis of Hnrnpu KD cells after 24 hr of ex vivo differentiation. Data are mean ± SEM from n = 2 experiments. (D) Hnrnpu knockdown impairs red cell enucleation. Data are mean ± SEM from n = 3 experiments. (E) Hnrnpu-depleted cells phenocopy the gene expression changes of Bloodlinc-depleted cells. Gene set enrichment analysis of Bloodlinc-inducible and Bloodlinc-repressible genes in Hnrnpu KD cells. NES, normalized enrichment score. *p < 0.05 relative to control, t test. See also Figure S6 and Table S4.
Figure 6
Figure 6. Bloodlinc Can Promote Terminal Red Cell Development
(A) Ectopically expressed Bloodlinc promotes proliferation of erythroid precursors. Shown are live cell numbers of primary erythroid progenitors transduced with empty or Bloodlinc-expressing vector and kept in maintenance medium. (B) Bloodlinc ectopic expression stimulates erythroid precursor cell cycling. Cells in G1 or in S/G2/M phases after culture for 48 hr in maintenance medium are quantified. (C) Ectopically expressed Bloodlinc prompts erythroid precursors to terminally differentiate and undergo enucleation. Flow cytometry plots show levels of the differentiation marker TER119 versus DNA content for live primary erythroid progenitors cultured for 48 hr in maintenance medium. Lower right quadrants identify enucleated reticulocytes, quantified to the right. Data are mean ± SEM from n = 2 experiments with n = 1 or 2 replicate measurements each. *p < 0.05 relative to control, t test. See also Figure S6.

Comment in

References

    1. Alvarez-Dominguez JR, Hu W, Yuan B, Shi J, Park SS, Gromatzky AA, van Oudenaarden A, Lodish HF. Global discovery of erythroid long noncoding RNAs reveals novel regulators of red cell maturation. Blood. 2014;123:570–581. - PMC - PubMed
    1. Alvarez-Dominguez JR, Zhang X, Hu W. Widespread and dynamic translational control of red blood cell development. Blood. 2017;129:619–629. - PMC - PubMed
    1. Ashe HL, Monks J, Wijgerde M, Fraser P, Proudfoot NJ. Intergenic transcription and transinduction of the human beta-globin locus. Genes Dev. 1997;11:2494–2509. - PMC - PubMed
    1. Buecker C, Wysocka J. Enhancers as information integration hubs in development: lessons from genomics. Trends Genet. 2012;28:276–284. - PMC - PubMed
    1. Burke B, Stewart CL. The nuclear lamins: flexibility in function. Nat Rev Mol Cell Biol. 2013;14:13–24. - PubMed

Publication types

Substances