. 2017 Jun 20;19(12):2572-2585.
doi: 10.1016/j.celrep.2017.05.079.

Transduction of Repetitive Mechanical Stimuli by Piezo1 and Piezo2 Ion Channels

Affiliations

Transduction of Repetitive Mechanical Stimuli by Piezo1 and Piezo2 Ion Channels

Amanda H Lewis et al. Cell Rep. .

Abstract

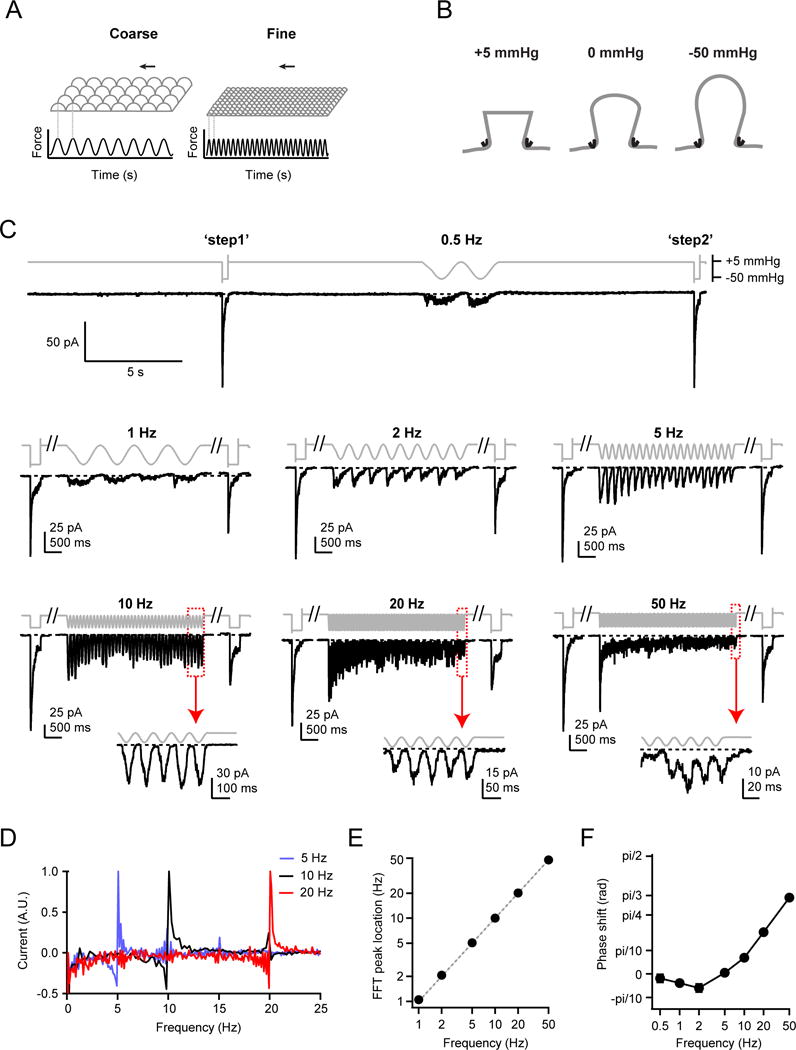
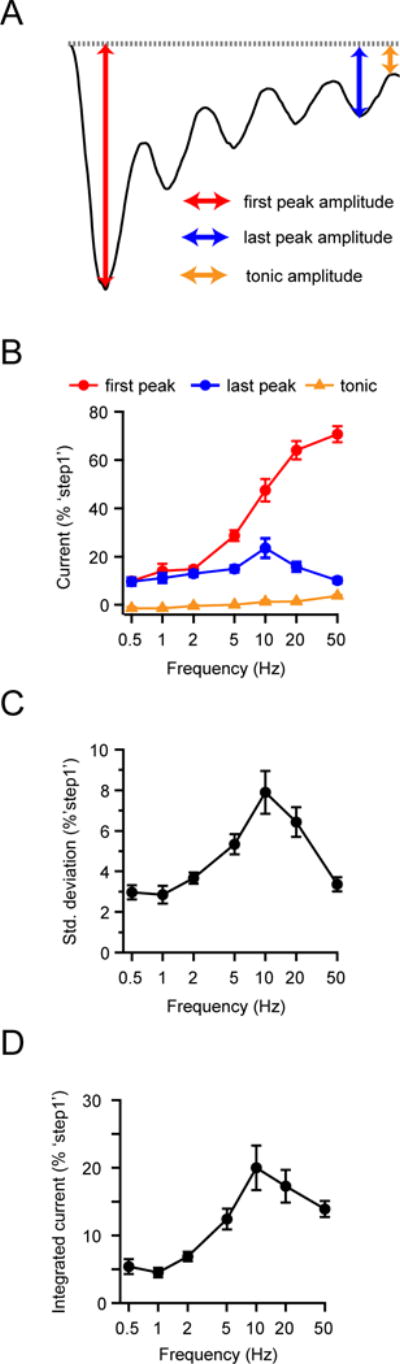
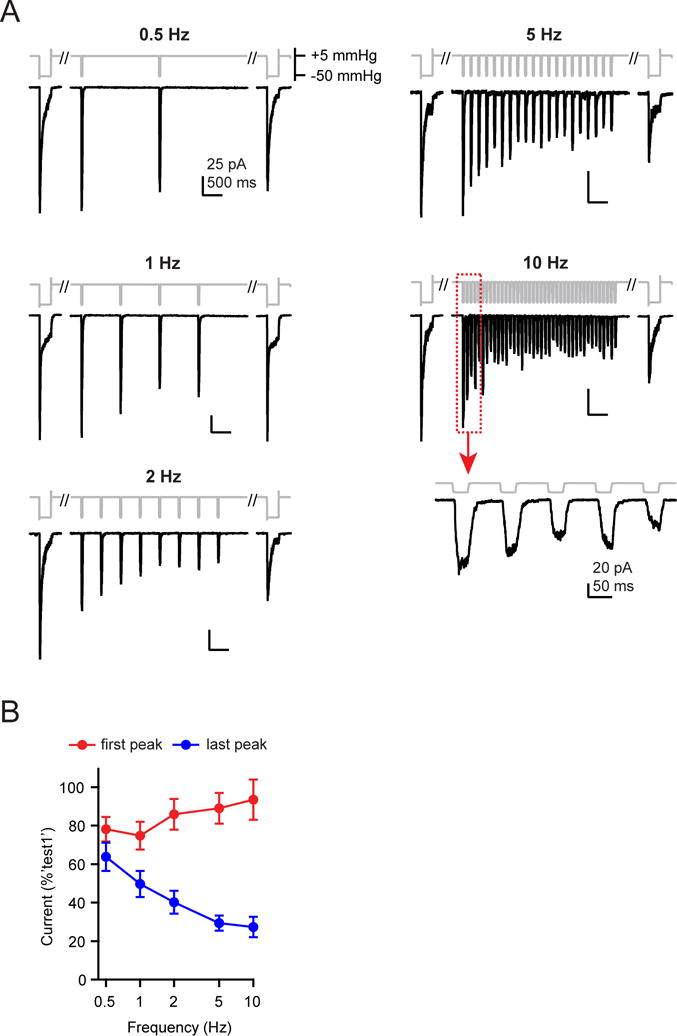
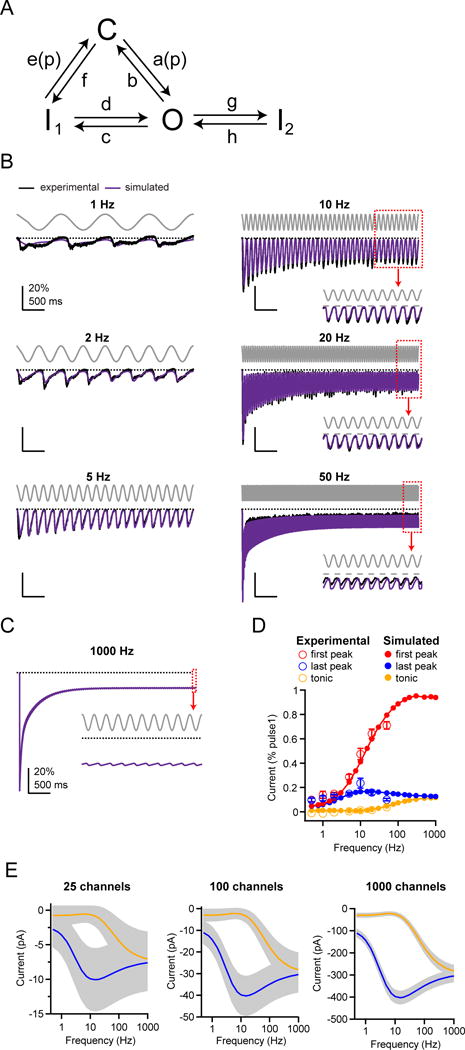
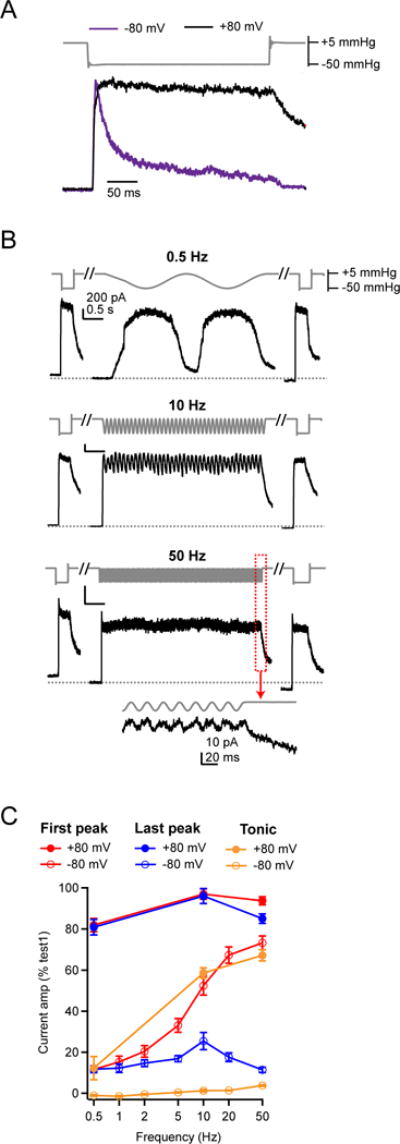
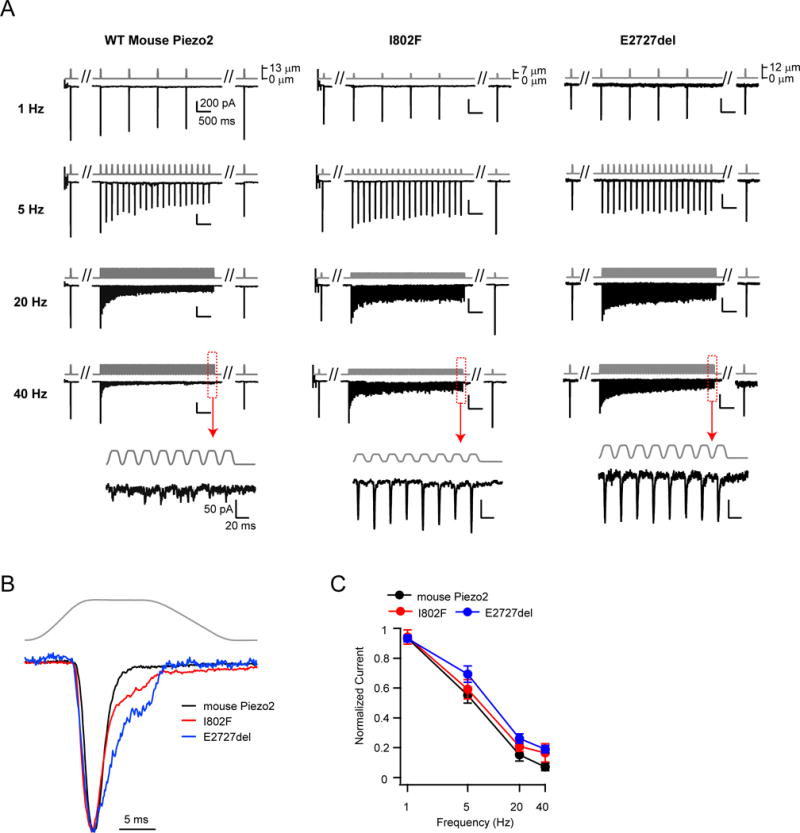
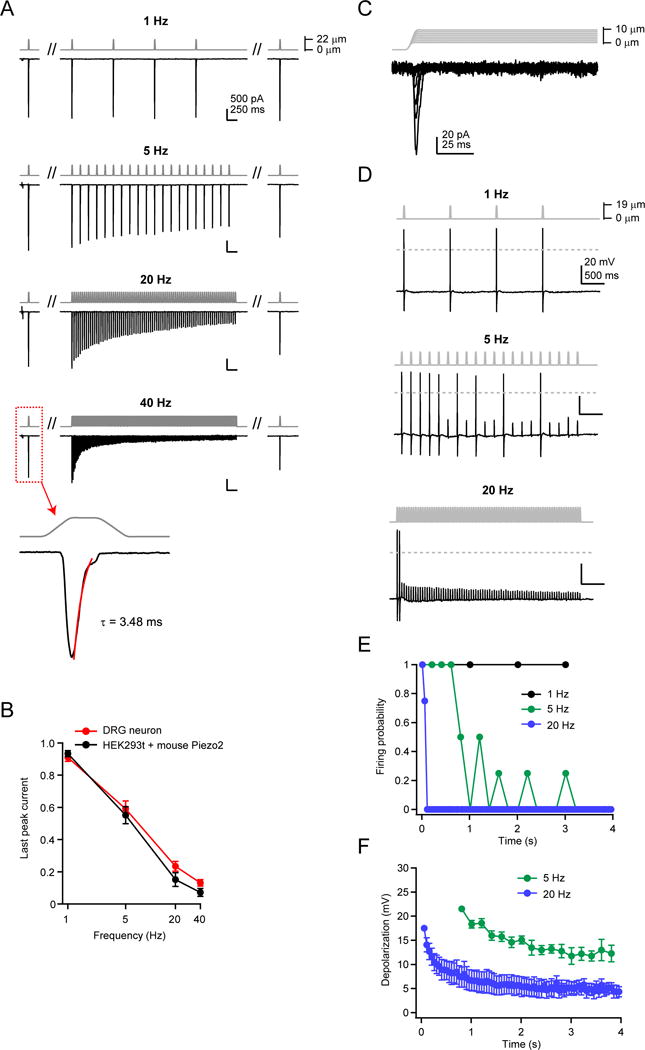
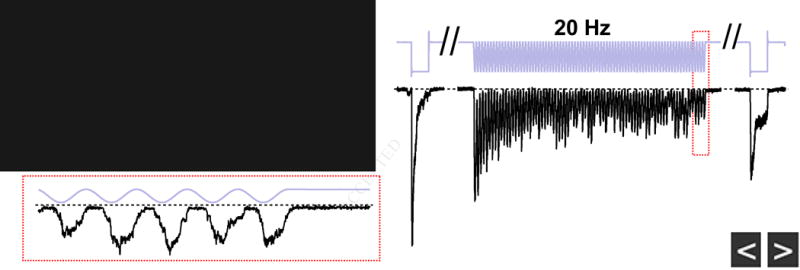
Several cell types experience repetitive mechanical stimuli, including vein endothelial cells during pulsating blood flow, inner ear hair cells upon sound exposure, and skin cells and their innervating dorsal root ganglion (DRG) neurons when sweeping across a textured surface or touching a vibrating object. While mechanosensitive Piezo ion channels have been clearly implicated in sensing static touch, their roles in transducing repetitive stimulations are less clear. Here, we perform electrophysiological recordings of heterologously expressed mouse Piezo1 and Piezo2 responding to repetitive mechanical stimulations. We find that both channels function as pronounced frequency filters whose transduction efficiencies vary with stimulus frequency, waveform, and duration. We then use numerical simulations and human disease-related point mutations to demonstrate that channel inactivation is the molecular mechanism underlying frequency filtering and further show that frequency filtering is conserved in rapidly adapting mouse DRG neurons. Our results give insight into the potential contributions of Piezos in transducing repetitive mechanical stimuli.

Keywords: Piezo1; Piezo2; dorsal root ganglia neurons; four-state gating mechanism; frequency filtering; inactivation; mechanosensitive ion channel; mechanotransduction; repetitive stimulation.


Figures

Figure 1
Figure 1. Repetitive sinusoidal pressure stimulation induces phase-locked oscillating inward currents in Piezo1-expressing HEK293t cells
(A) Schematic depicting two possible stimulus patterns (force over time) sensed by a fingertip brushing over a textured surface. (B) Schematic showing cell-attached high-speed pressure-clamp experiments, in which a small positive pressure (+5 mmHg) minimizes membrane curvature and Piezo1 open probability, while a large negative pressure (−50 mmHg) induces small curvature and high membrane tension and maximal Piezo1 open probability (Lewis and Grandl, 2015). (C) Stimulus protocols and representative raw currents from cell-attached patches from HEK293t cells transiently transfected with Piezo1. 4 s sinusoidal pressure cycles oscillating between +5 and −50 mmHg at frequencies from 0.5 Hz to 50 Hz were applied. Dashed lines are zero current levels. Insets show magnifications of the last five pressure cycles at 10, 20 and 50 Hz. Each current trace is from a separate cell-attached patch. (D) Fast-Fourier transformations (FFT) of the 5 Hz, 10 Hz, and 20 Hz current traces from (C). (E) Average FFT maxima locations as a function of stimulus frequency (N = 68 cells). Error bars are obscured by data points. Dashed grey line represents unity, not a fit to the data. (F) Phase shift of currents relative to pressure stimulus for the last 2 s of stimulation. Error bars are obscured by data points. See also Figures S1, S2, S3.
Figure 2
Figure 2. Piezo1 channels function as bandpass filters of sinusoidal pressure stimuli
(A) Illustration of current trace with time points for ‘first peak’ (red), ‘last peak’ (blue) and ‘tonic current’ (orange) highlighted. (B) Mean amplitudes of the ‘first peak’, ‘last peak’, and ‘tonic current’ of HEK293t cells transiently transfected with Piezo1 as a function of sinusoidal pressure stimulus frequency. All currents were individually normalized to the peak current of ‘step1’ (see Figure 1C). (C) Standard deviation of current during the last two s as a function of stimulus frequency, normalized to peak amplitude of ‘step1’. All data are mean ± s.e.m.; N = 8–13 cells per frequency. (D) Integrated current during the last two s of a four s sinusoidal pressure stimulus, as a function of frequency, normalized to the peak current of ‘step1’. See also Figure S1.
Figure 3
Figure 3. Piezo1 channels function as low-pass filters of square pulse pressure stimuli
(A) Repetitive square pulse pressure protocols (30 ms at −50 mmHg, varying times at +5 mmHg) and representative raw currents from HEK293t cells transiently transfected with Piezo1. Scale bars (25 pA, 500 ms) apply to all traces except 10 Hz inset (20 pA, 50 ms). (B) Mean amplitudes of the ‘first peak’ (red circles) and ‘last peak’ (blue circles) currents, normalized to the peak amplitude of ‘step1’. All data are mean ± s.e.m. N = 7–11 cells per frequency. See also Figures S1, S5.
Figure 4
Figure 4. A three state gating mechanism describes Piezo1 frequency filtering
(A) Schematic for a four state gating mechanism for Piezo1, with arrows indicating transitions between open (O), closed (C) and two inactivated states (I1 and I2). Rate constants a(p) = a0·exp(−p/k) (closed to open) and e(p) = e0·exp(p/k) (inactivated to closed) are pressure-dependent. (B) Stimulus protocol (gray), normalized and averaged experimental currents from HEK293t cells transiently transfected with Piezo1 elicited by a sinusoidal pressure stimulus (see Figure 1) (black) and corresponding simulated currents using the best fit to the model in (A) (purple). Dashed line represents zero current. Insets show magnifications of the last pressure cycles. (C) Simulated current response for a 1 kHz sinusoidal pressure stimulus. Inset shows magnifications of the last pressure cycles. (D) Experimental and simulated mean amplitudes of the ‘first peak’ and ‘last peak’ currents and ’tonic‘ current, normalized to ‘step1’, as a function of stimulus frequency. (E) Simulated current amplitudes for mean “last peak” (solid black lines) and “tonic” currents (dashed black lines) and coefficient of variation (gray shading) as a function of stimulus frequency for N = 25, 100, and 1000 channels. Coefficient of variation was calculated as σI=1qNq, where q is open probability and I = N*g*V is current. Currents were calculated with a single-channel conductance of 30 pS and a holding potential of −80mV (Coste et al., 2012). See also Figures S4, S5.
Figure 5
Figure 5. Inactivation is required for Piezo1 frequency filtering
(A) Stimulus protocol (gray) and representative currents in response to a static, 300 ms negative pressure step from two HEK293t cells transiently transfected with Piezo1 in cell-attached patches held at −80 mV (purple, inverted for ease of comparison) and +80 mV (black). Currents are normalized to their peak. (B) Sinusoidal stimulus protocol and representative outward currents from cell-attached patches held at +80 mV. Scale bar (200 pA, 0.5 s) applies to all three traces. (C) Mean amplitudes of the ‘first peak’ and ‘last peak’ current as a function of stimulus frequency. Currents are normalized to the peak amplitude of ‘step1’. All data are mean ± s.e.m.; N = 6–13 cells per stimulus frequency.
Figure 6
Figure 6. Piezo2 channels function as low-pass filters of square pulse poke stimuli
(A) Stimulus protocol (gray) and representative currents (black) from HEK293t cells transiently transfected with wild-type (left) or mutant Piezo2 (I802F, center and E2727del, right). Insets show responses to 40 Hz stimulation at an expanded timescale. (B) Representative currents of wild-type Piezo2 (black), and mutants I802F (red) and E2727del (blue) in response to a single test pulse. Currents are normalized to their peak. (C) Amplitude of the ‘last peak’ current, normalized to the amplitude of ‘first peak’ current at each stimulation frequency. Holding potential was −100 mV. All data are mean ± s.e.m. N = 9–11 cells per construct.
Figure 7
Figure 7. Rapidly-adapting DRG neurons show identical frequency filtering to mouse Piezo2 in HEK293t cells
(A) Stimulus protocol and representative currents from a whole-cell recording from a single mouse DRG neuron, elicited by a 20 ms square pulse poke stimulus at 1, 5, 20, and 40 Hz. All four frequencies were tested on the same cell. The cell displayed rapidly-adapting mechanosensitive currents (inset, 40 Hz), with an inactivation time course of τ <10 ms (Ranade et al., 2014b). Holding potential was −80 mV. (B) Amplitude of the last peak current, normalized to ‘step1’, for rapidly-adapting DRG neurons (red, N = 7) and HEK293t cells transiently transfected with wild-type mouse Piezo2 (black, N = 10). (C) Stimulus protocol (gray) and representative current (black) from a rapidly-adapting DRG neuron in voltage clamp. (D) Stimulus protocol and action potentials elicited from the same neuron as in (C), in current clamp. Dashed line is 0 mV. (E) Firing probability for DRG neurons in response to 1, 5, and 20 Hz mechanical stimulation. Action potentials were counted for all responses crossing 0 mV. N = 4 neurons; all frequencies tested on each neuron. (F) Amplitude of subthreshold responses to 5 and 20 Hz from stimuli that failed to evoke action potentials in (E). All data are mean ± s.e.m.

References

    1. Albuisson J, Murthy SE, Bandell M, Coste B, Louis-dit-Picard H, Mathur J, Feneant-Thibault M, Tertian G, de Jaureguiberry JP, Syfuss PY, et al. Dehydrated hereditary stomatocytosis linked to gain-of-function mutations in mechanically activated PIEZO1 ion channels (vol 4, pg 1884, 2013) Nature Communications 4 2013 - PMC - PubMed
    1. Bae C, Gnanasambandam R, Nicolai C, Sachs F, Gottlieb PA. Xerocytosis is caused by mutations that alter the kinetics of the mechanosensitive channel PIEZO1. Proc Natl Acad Sci U S A. 2013a;110:E1162–1168. - PMC - PubMed
    1. Bae C, Gottlieb PA, Sachs F. Human PIEZO1: removing inactivation. Biophys J. 2013b;105:880–886. - PMC - PubMed
    1. Bae C, Sachs F, Gottlieb PA. Protonation of the human PIEZO1 ion channel stabilizes inactivation. J Biol Chem. 2015;290:5167–5173. - PMC - PubMed
    1. BensmaIa SJ, Hollins M. The vibrations of texture. Somatosens Mot Res. 2003;20:33–43. - PMC - PubMed

Publication types