. 2017 Jun 20;46(6):1045-1058.e6.
doi: 10.1016/j.immuni.2017.06.005.

Germinal Center Selection and Affinity Maturation Require Dynamic Regulation of mTORC1 Kinase

Affiliations

Germinal Center Selection and Affinity Maturation Require Dynamic Regulation of mTORC1 Kinase

Jonatan Ersching et al. Immunity. .

Abstract

During antibody affinity maturation, germinal center (GC) B cells cycle between affinity-driven selection in the light zone (LZ) and proliferation and somatic hypermutation in the dark zone (DZ). Although selection of GC B cells is triggered by antigen-dependent signals delivered in the LZ, DZ proliferation occurs in the absence of such signals. We show that positive selection triggered by T cell help activates the mechanistic target of rapamycin complex 1 (mTORC1), which promotes the anabolic program that supports DZ proliferation. Blocking mTORC1 prior to growth prevented clonal expansion, whereas blockade after cells reached peak size had little to no effect. Conversely, constitutively active mTORC1 led to DZ enrichment but loss of competitiveness and impaired affinity maturation. Thus, mTORC1 activation is required for fueling B cells prior to DZ proliferation rather than for allowing cell-cycle progression itself and must be regulated dynamically during cyclic re-entry to ensure efficient affinity-based selection.

Keywords: B cell; antibody; cell cycle; cell size; germinal center; mTOR.


Figures

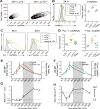
Figure 1
Figure 1. GC B cells activate mTORC1 upon positive selection
(A) Experimental setup for RNA-seq of Ly75+/+ GC B cells following forced positive selection using DEC-OVA. Host mice were Ly75−/−.LY75-tg in panels (B,E,F) and wild-type C57BL6 in panels (G–J) (see STAR Methods). (B) Enrichment of gene signatures related to activation of the mTORC1 pathway in LZ Ly75+/+ GC B cells 12 h after DEC-OVA injection. Number in top-right corner is the enrichment score; all p-values and FDRs = 0 (below detection). (C) Immunofluorescence showing c-Myc and phospho-S6 in LZ and DZ cells from popliteal lymph node GCs 14 days after footpad immunization with NP-KLH in alum. Scale bar, 50 μm. (D) Phospho-S6 staining in c-Myc-positive and negative GC B cells from popliteal lymph nodes of MycGFP/GFP reporter mice 12 days after footpad immunization with KLH in alum. GFP fluorescence in GC B cells from a wild-type C57BL6 is shown as a control. (E–F) Phospho-S6 staining in LZ and DZ cells at the indicated time points after DEC-OVA-targeted positive selection of Ly75+/+ GC B cells, following the setup depicted in (A). (G–H) Phospho-S6 staining in Ly75+/+ GC B cells after positive selection using different doses of DEC-OVA or at different proportions of Ly75+/+ B1-8hi B cells in the adoptive transfer (5% vs. 25%). (I–J) Phospho-S6 staining in Ly75+/+ GC B cells following blockade of CD40L. Mice were injected intravenously with 200 μg of a blocking antibody to CD40L (clone MR-1) or a matched isotype control 2 h prior to DEC-OVA. Samples in panels (G–J) were analyzed 12 h after DEC-OVA. *** p<0.001, unpaired Student t test. Bars indicate mean ± SEM. All data are from at least two independent experiments. (B, n=3; C, n=3; D, n=4; E–F, n=5–6; G–H, n=3–4; I–J, n=3) See also Figure S1.
Figure 2
Figure 2. mTORC1 activation in GC B cells leads to ribosomal biogenesis and cell growth
(A) Forward scatter and Pyronin Y staining (dsRNA content) in Ly75+/+ and Ly75−/− GC B cells 36 h after DEC-OVA injection. (B) Glucose uptake in vivo by Ly75+/+ and Ly75−/− GC B cells, 24 h after DEC-OVA injection, with or without injection of rapamycin at 6 h after DEC-OVA. Measured by intravenous injection of 5 mg/kg of 2-(N-(7-nitrobenz-2-oxa-1,3-diazol-4-yl)amino)-2-deoxyglucose (2-NBDG) 25 min prior to organ harvesting. (C–D) Pyronin Y staining and forward scatter of Ly75+/+ cells 36 h after DEC-OVA injection, with or without treatment with rapamycin 12 h after DEC-OVA. (E–H) Kinetics of forward scatter, S6 phosphorylation, Pyronin Y staining, expansion of Ly75+/+ cells (Ly75+/+/Ly75−/− ratio) and Ly75+/+ DZ/LZ ratio following DEC-OVA injection. * p<0.05, **p<0.01, unpaired Student t test. Bars indicate mean ± SD. Data pooled from at least two independent experiments. (A, n=6; B, n=3; C–D, n=6; E–H, n=4–7). See also Figure S2.
Figure 3
Figure 3. Decreased cell size correlates with return from DZ to LZ
(A–B) Experimental setup for assessment of migration of early DZ to LZ emigrants by flow cytometry. (C) Representative plots showing photoactivated cells in DZ (red gates) and LZ (blue gates) at 0 h or 8 h after photoactivation. (D) Forward scatter of individual cells in DZ and LZ 8 h after photoactivation of single GCs. Dashed lines indicate the average cell size of Ly75−/− GC B cells from the same GC. Bars indicate mean. (E) DZ and LZ cell size average from each GC. *p<0.05, **p<0.01, ***p<0.001, unpaired Student t test. Each GC is from a different mouse in three independent experiments (n=3).
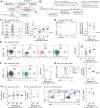
Figure 4
Figure 4. mTORC1-induced cell growth is required for expansion and accumulation in DZ of positively selected B cells
(A–B) Experimental setup for DEC-OVA-induced positive selection of Ly75+/+ GC B cells followed by mTORC1 inhibition using rapamycin before, midway through, or after cell growth and LZ to DZ migration. Clonal expansion (C–D), DZ accumulation (E–F), Foxo1 upregulation (G), DNA content (Hoechst) (H–I), and S-phase entry (J) among Ly75+/+ GC B cells upon treatment with rapamycin at the indicated timepoints after DEC-OVA injection. S phase entry (J) is measured by sequential injection of EdU followed by BrdU 1 h later. Cells in early S phase are positive for BrdU only (see STAR Methods). *p<0.05, **p<0.01, ****p<0.0001, n.s. non-significant, unpaired Student t test, compared to rapamycin-untreated group. Bars indicate mean. Data pooled from at least two independent experiments. (C, n=8; D, n=6; E, n=8; F, n=4; G, n=3; H, n=6; I, n=4; J, n=3). See also Figure S3.
Figure 5
Figure 5. B cell-intrinsic role of mTORC1 in GC selection
(A) CRISPR/Cas9 gene targeting strategy for generating mice carrying F2108L mutation in Mtor. (B) Immunoblots from tail fibroblasts from Mtor+/+ and MtorF2108L/+ animals cultured in presence and absence of rapamycin. (C) Rapamycin-resistant hosts received adoptive transfer of B1-8hi L75+/+.Mtor+/+ B cells for targeted selection in GCs by DEC-OVA injection 12 h prior to rapamycin treatment (see Fig. S5A). (D) Phospho-S6 staining in transferred L75+/+.Mtor+/+ and host Ly75+/+.MtorF2108L/F2108L GC B cells. (E) Ly75+/+/Ly75−/− ratio and (F) DZ/LZ ratio in Ly75+/+.Mtor+/+ GC B cells. (G) Wild-type hosts received adoptive transfer of B1-8hi Ly75+/+.Mtor+/+ or B1-8hi L75+/+.MtorF2108L/F2108L B cells for targeted selection in GCs by DEC-OVA injection 12 h prior to rapamycin treatment (see Fig. S5E). (H) Phospho-S6 staining of transferred Ly75+/+.Mtor+/+ or Ly75+/+.Mtor F2108L/F2108L cells treated or not with rapamycin. (I) Ly75+/+/Ly75−/− ratio, and (J) DZ/LZ ratio of transferred Ly75+/+ cells in GCs. (K) Phospho-S6 staining in Tfh cells (CXCR5+ PD-1hi) from MtorF2108L/F2108L [see panel (C)] and Mtor+/+ [see panel (D)] mice treated or not with rapamycin. Note that Tfh cells from Mtor F2108L/F2108L mice are fully resistant to rapamycin. (C–F) *p<0.05, **p<0.01, ****p<0.0001, unpaired Student t test. Bars indicate mean. Data pooled from at least two independent experiments. (C–F, n=2–3; G–J, n=7–9; K n=2–9) See also Figures S4–5.
Figure 6
Figure 6. Hyperactivation of mTORC1 imposes DZ confinement and a competitive disadvantage on GC B cells
(A) Experimental setup for induction of GCs containing mixtures of B1-8hi cells sufficient and deficient in Tsc1 upon AID-mediated deletion. (B) Phospho-S6 in GC B1-8hi cells 10 days after NP-OVA immunization. (C) DZ and LZ staining in GC B1-8hi cells 10 days after NP-OVA immunization, quantified over time in (D). (E) Relative percentage (normalized to day 7 after immunization) of Tsc1 deficient GC B cells at the indicated time points after NP-OVA injection. (F) Experimental setup for induction of GCs containing mixtures of B1-8i cells carrying Rraga+/+ and RragaGTP/GTP. (G–J) As in (B–E) but using RragaGTP/GTP as an mTORC1 gain-of-function allele. B cell donors were either full-body mutant mice or bone marrow chimeras (see STAR Methods). *p<0.05, **p<0.01, ***p<0.001, ****p<0.0001, unpaired Student t test. Bars indicate mean. Data pooled from at least two independent experiments. (A–E, n=4–5; F–J, n=3)
Figure 7
Figure 7. mTORC1 hyperactivation impairs affinity maturation
Cd79acre/+.Tsc1+/+ and Cd79acre/+.Tsc1fl/fl bone marrow chimeras (see STAR Methods) were immunized i.p. with 50 μg of NP-OVA and serum was obtained at the indicated timepoints post-immuization. (A) Titers of total (NP24-binding) and high-affinity (NP2-binding) antibodies and (B) NP2/NP24 titer ratio in these mice. (C–D) as in (A–B) but using Rraga+/+ and RragaGTP/GTP fetal liver chimeras. (E) Total number of VH mutations and (F) number of W33L high-affinity mutations in single-cell sorted GC B cells from wild type mice adoptively transferred with B1-8i Rraga+/+ or B1-8i RragaGTP/GTP B cells, obtained from popliteal lymph nodes harvested 12 days after immunization with NP-OVA. Data pooled from two independent experiments. *p<0.05, **p<0.01, ****p<0.0001, n.s. non-significant, unpaired Student t test. In A–D, bars indicate mean ± SEM; in E bars indicate mean. (A–B, n=8–9; C–D, n=8; E–F, n=2)

Comment in

  • The TORC that Gets the GC Cycling.
    Deenick EK, Tangye SG. Deenick EK, et al. Immunity. 2017 Jun 20;46(6):974-976. doi: 10.1016/j.immuni.2017.06.003. Immunity. 2017. PMID: 28636966

References

    1. Aagaard-Tillery KM, Jelinek DF. Inhibition of human B lymphocyte cell cycle progression and differentiation by rapamycin. Cell Immunol. 1994;156:493–507. - PubMed
    1. Allen CD, Okada T, Cyster JG. Germinal-center organization and cellular dynamics. Immunity. 2007;27:190–202. - PMC - PubMed
    1. Allen D, Simon T, Sablitzky F, Rajewsky K, Cumano A. Antibody engineering for the analysis of affinity maturation of an anti-hapten response. EMBO J. 1988;7:1995–2001. - PMC - PubMed
    1. Amati B, Alevizopoulos K, Vlach J. Myc and the cell cycle. Frontiers in bioscience : a journal and virtual library. 1998;3:d250–268. - PubMed
    1. Araki K, Turner AP, Shaffer VO, Gangappa S, Keller SA, Bachmann MF, Larsen CP, Ahmed R. mTOR regulates memory CD8 T-cell differentiation. Nature. 2009;460:108–112. - PMC - PubMed

MeSH terms