. 2017 Sep 1;158(9):3055-3066.
doi: 10.1210/en.2017-00399.

An Essential Physiological Role for MCT8 in Bone in Male Mice

Affiliations

An Essential Physiological Role for MCT8 in Bone in Male Mice

Victoria D Leitch et al. Endocrinology. .

Abstract

T3 is an important regulator of skeletal development and adult bone maintenance. Thyroid hormone action requires efficient transport of T4 and T3 into target cells. We hypothesized that monocarboxylate transporter (MCT) 8, encoded by Mct8 on the X-chromosome, is an essential thyroid hormone transporter in bone. To test this hypothesis, we determined the juvenile and adult skeletal phenotypes of male Mct8 knockout mice (Mct8KO) and Mct8D1D2KO compound mutants, which additionally lack the ability to convert the prohormone T4 to the active hormone T3. Prenatal skeletal development was normal in both Mct8KO and Mct8D1D2KO mice, whereas postnatal endochondral ossification and linear growth were delayed in both Mct8KO and Mct8D1D2KO mice. Furthermore, bone mass and mineralization were decreased in adult Mct8KO and Mct8D1D2KO mice, and compound mutants also had reduced bone strength. Delayed bone development and maturation in Mct8KO and Mct8D1D2KO mice is consistent with decreased thyroid hormone action in growth plate chondrocytes despite elevated serum T3 concentrations, whereas low bone mass and osteoporosis reflects increased thyroid hormone action in adult bone due to elevated systemic T3 levels. These studies identify an essential physiological requirement for MCT8 in chondrocytes, and demonstrate a role for additional transporters in other skeletal cells during adult bone maintenance.


Figures

Figure 1.
Figure 1.
Serum thyroid hormone levels. (a) Total T4 and (c) rT3 levels in P1, P14, P32, P77, and P112 mice, and (b) total T3 and (d) TSH in P14, P32, P77, and P112 mice. Data are mean ± standard error of the mean; n = 3–5 per genotype per age; *P < 0.05, **P < 0.01, ***P < 0.001 vs WT; #P < 0.05, ##P < 0.01, ###P < 0.001 vs Mct8KO; analysis of variance followed by Tukey post hoc test.
Figure 2.
Figure 2.
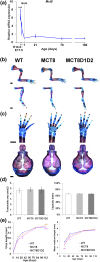
Skeletal development and linear growth. (a) Mct8 mRNA expression in whole tibias from WT mice (n = 8 biological replicates per group, 2 technical replicates per sample); analysis of variance (ANOVA) , two-sided Tukey post hoc test; ***P < 0.001 vs expression at P1. (b) Limbs from P1 WT, Mct8KO, and Mct8D1D2KO mice stained with alizarin red (bone) and alcian blue (cartilage); scale bar = 1 mm. (c) Forelimb digits and cranial vaults stained with alizarin red and alcian blue; scale bar = 1 mm. (d) Fontanelle area and cephalic index (cephalic index is calculated by dividing cranial width by cranial length and then multiplying the result by 100) in P1 skulls, n = 4 per genotype. (e) Ulna lengths and caudal vertebra heights from birth to P112.Data are mean ± standard error of the mean; n = 4 per genotype per age; *P < 0.05, **P < 0.01, ***P < 0.001 vs WT; ANOVA followed by Tukey post hoc test.
Figure 3.
Figure 3.
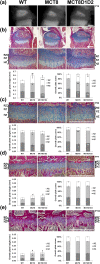
Endochondral ossification. (a) Microradiographs of proximal tibia from P14 WT, Mct8KO, and Mct8D1D2KO mice; scale bar = 0.5 mm. (b) Decalcified sections of P14 proximal tibia stained with alcian blue (cartilage) and van Gieson (bone matrix); scale bars = 0.5 mm. The left graph shows growth plate, RZ, PZ, and HZ heights. The graph on the right shows relative values, where each zone is shown as a percentage of total growth plate height. (c–e) Proximal tibia sections from P32, P77, and P112 mice with graphs showing total and relative growth plate zone heights. Data are mean ± standard error of the mean; n = 4 per genotype; *P < 0.05, **P < 0.01, ***P < 0.001 vs height of zone in WT; #P < 0.05, ##P < 0.01 vs total growth plate height in WT; analysis of variance followed by Tukey post hoc test; scale bars = 0.5 mm.
Figure 4.
Figure 4.
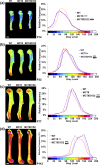
Bone mineral content. Quantitative microradiographic images of long bones from (a) P14, (b) P32, (c) P77, and (d) P112 WT, Mct8KO and Mct8D1D2KO mice; scale bars = 1 mm. Pseudocolored images represent grayscale images using a 16-color interval scheme with low mineral content in blue and high mineral content in pink. Relative frequency histograms of BMC (n = 4 per genotype per age). *P < 0.05, **P < 0.01, ***P < 0.001 vs WT, ###P < 0.001 vs Mct8KO; Kolmogorov-Smirnov test.
Figure 5.
Figure 5.
Bone structure. (a) Longitudinal midline microcomputerized tomography–rendered images of distal femur from P112 WT, Mct8KO and Mct8D1D2KO mice; scale bars = 2 mm. (b) Transverse views of proximal (upper panels), midshaft (middle panels), and distal (lower panels) femur; scale bars = 2 mm. (c) Trabecular bone structural parameters: BV/TV, Tb.N, Tb.Th, and structure model index (SMI). Data are mean ± standard error of the mean; n = 4 per genotype; *P < 0.05, **P < 0.01 vs WT; analysis of variance (ANOVA) followed by Tukey post hoc test. (d) Cortical bone structural parameters: cortical bone volume and cortical thickness. Data are mean ± standard error of the mean; n = 4 per genotype; *P < 0.05, **P < 0.01 vs WT; ANOVA followed by Tukey post hoc test.
Figure 6.
Figure 6.
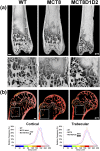
Bone microarchitecture and micromineralization density. (a) Low- and higher-power BSE-SEM images of distal femur from P77 WT, Mct8KO, and Mct8D1D2KO mice. Images are representative examples of n = 4 per genotype; scale bars = 200 μm. (b) Quantitative BSE-SEM images of proximal humerus from P77 WT, Mct8KO, and Mct8D1D2KO mice; scale bars = 200 μm. Grayscale images were pseudocolored using an eight-color interval scheme with low mineralization density in blue and high density in pink/white. White boxes indicate the region of interest used for quantitation of trabecular bone micromineralization density. Relative frequency histograms of bone micromineralization densities of proximal humerus and trabecular bone compartment. Images representative of n = 4 per genotype; ***P < 0.001 vs WT, #P < 0.05 vs Mct8KO, ###P < 0.001 vs Mct8KO; Kolmogorov-Smirnov test.
Figure 7.
Figure 7.
Osteoclastic bone resorption and osteoblastic bone formation. (a) Three-dimensional BSE-SEM images of trabecular bone and midfemur endocortical bone surface from femurs of P77 WT, Mct8KO, and Mct8D1D2KO mice (arrows indicate borders between regions of osteoclastic resorption and unresorbed bone surfaces, scale bars = 200 μm). Resorption surfaces shown as percentage of total bone surface in trabecular and cortical bone. Data are mean ± standard error of the mean; n = 4 per genotype; *P < 0.05 vs WT; analysis of variance followed by Tukey post hoc test. (b) Section from proximal humerus of P77 mice stained with tartrate-resistant acid phosphatase for osteoclasts in red; scale bar = 200 μm. Number of osteoclasts per millimeter of bone surface (OcN/BS) and osteoclast surface per millimeter of bone surface (OcS/BS). (c) Confocal images of humerus cortical bone double-labeled with calcein from P112 WT, Mct8KO, and Mct8D1D2KO mice; scale bars = 10 μm. Cortical MS, MAR, and BFR, n = 4 per genotype.
Figure 8.
Figure 8.
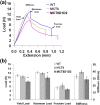
Bone strength. (a) Representative load displacement curves from three-point bend testing of P112 WT, Mct8KO, and Mct8D1D2KO tibias. (b) Yield, maximum and fracture loads, and stiffness. Data are mean ± standard error of the mean; n = 4 per genotype; *P < 0.05 vs WT; analysis of variance followed by Tukey post hoc test.

References

    1. Bassett JHD, Williams GR. Role of thyroid hormones in skeletal development and bone maintenance. Endocr Rev. 2016;37(2):135–187. - PMC - PubMed
    1. Bianco AC, Kim BW. Deiodinases: implications of the local control of thyroid hormone action. J Clin Invest. 2006;116(10):2571–2579. - PMC - PubMed
    1. Bernal J, Guadaño-Ferraz A, Morte B. Thyroid hormone transporters--functions and clinical implications. Nat Rev Endocrinol. 2015;11(7):406–417. - PubMed
    1. Williams AJ, Robson H, Kester MH, van Leeuwen JP, Shalet SM, Visser TJ, Williams GR. Iodothyronine deiodinase enzyme activities in bone. Bone. 2008;43(1):126–134. - PMC - PubMed
    1. Waung JA, Bassett JHD, Williams GR. Thyroid hormone metabolism in skeletal development and adult bone maintenance. Trends Endocrinol Metab. 2012;23(4):155–162. - PubMed

MeSH terms