. 2017 Aug 4;121(4):354-367.
doi: 10.1161/CIRCRESAHA.116.310529. Epub 2017 Jun 21.

Paradoxical Suppression of Atherosclerosis in the Absence of microRNA-146a

Affiliations

Paradoxical Suppression of Atherosclerosis in the Absence of microRNA-146a

Henry S Cheng et al. Circ Res. .

Abstract

Rationale: Inflammation is a key contributor to atherosclerosis. MicroRNA-146a (miR-146a) has been identified as a critical brake on proinflammatory nuclear factor κ light chain enhancer of activated B cells signaling in several cell types, including endothelial cells and bone marrow (BM)-derived cells. Importantly, miR-146a expression is elevated in human atherosclerotic plaques, and polymorphisms in the miR-146a precursor have been associated with risk of coronary artery disease.

Objective: To define the role of endogenous miR-146a during atherogenesis.

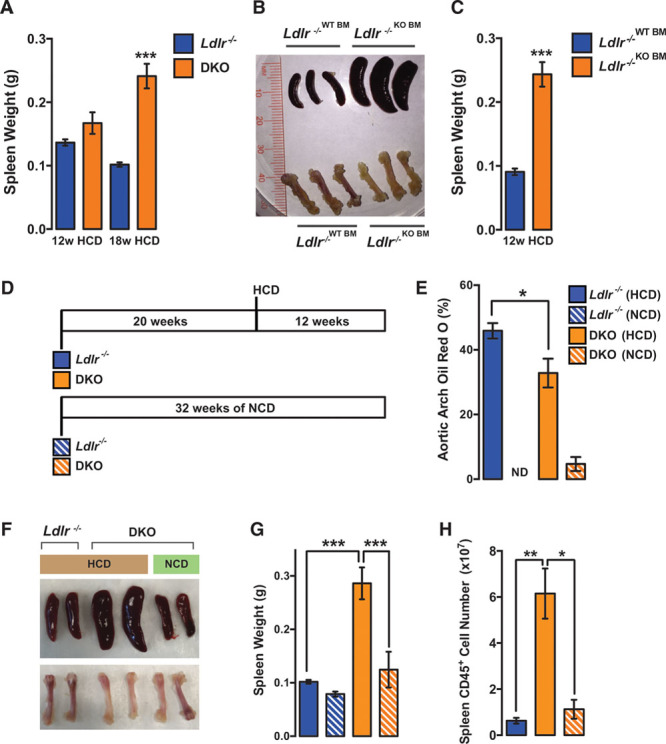
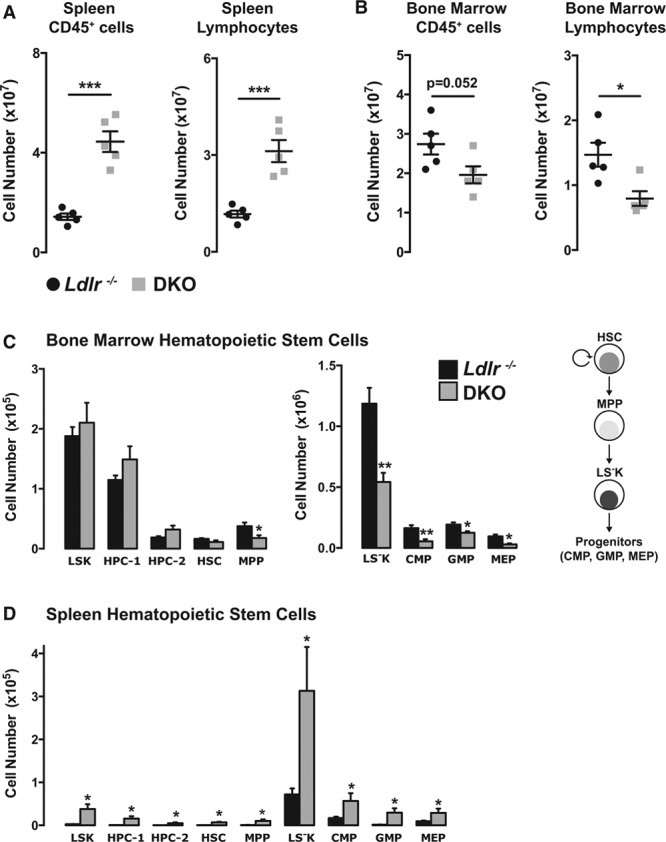
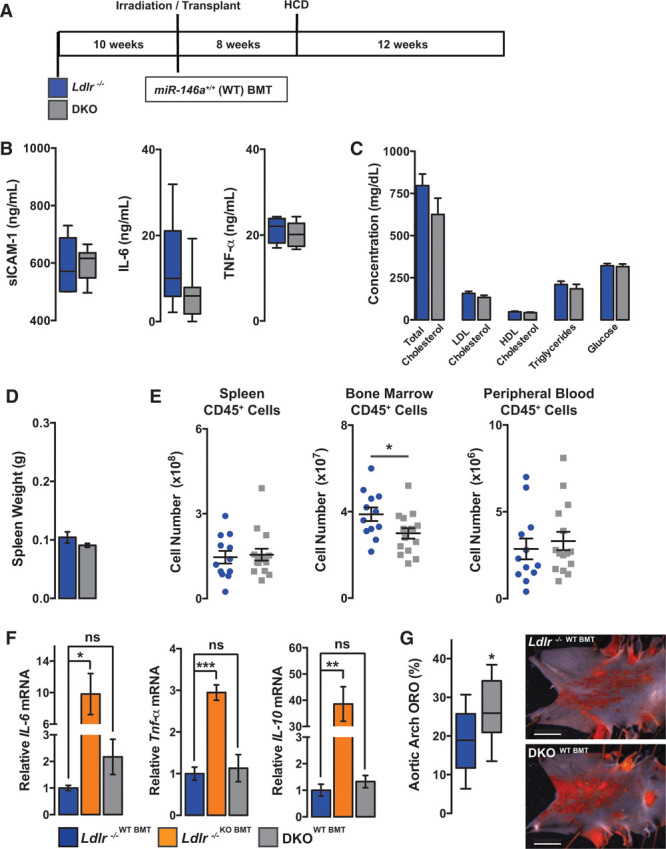
Methods and results: Paradoxically, Ldlr-/- (low-density lipoprotein receptor null) mice deficient in miR-146a develop less atherosclerosis, despite having highly elevated levels of circulating proinflammatory cytokines. In contrast, cytokine levels are normalized in Ldlr-/-;miR-146a-/- mice receiving wild-type BM transplantation, and these mice have enhanced endothelial cell activation and elevated atherosclerotic plaque burden compared with Ldlr-/- mice receiving wild-type BM, demonstrating the atheroprotective role of miR-146a in the endothelium. We find that deficiency of miR-146a in BM-derived cells precipitates defects in hematopoietic stem cell function, contributing to extramedullary hematopoiesis, splenomegaly, BM failure, and decreased levels of circulating proatherogenic cells in mice fed an atherogenic diet. These hematopoietic phenotypes seem to be driven by unrestrained inflammatory signaling that leads to the expansion and eventual exhaustion of hematopoietic cells, and this occurs in the face of lower levels of circulating low-density lipoprotein cholesterol in mice lacking miR-146a in BM-derived cells. Furthermore, we identify sortilin-1(Sort1), a known regulator of circulating low-density lipoprotein levels in humans, as a novel target of miR-146a.

Conclusions: Our study reveals that miR-146a regulates cholesterol metabolism and tempers chronic inflammatory responses to atherogenic diet by restraining proinflammatory signaling in endothelial cells and BM-derived cells.

Keywords: atherosclerosis; endothelial cells; hematopoiesis; inflammation; microRNAs.


Figures

Figure 1.
Figure 1.
MicroRNA-146a (miR-146a) is expressed in murine atherosclerotic plaques. A, Cross-sections of Ldlr−/− or Ldlr−/−;miR-146a−/− mouse aortic roots after 18 wk of high cholesterol diet (HCD). Expression of miR-146a, assessed by in situ polymerase chain reaction (red) overlaps with Mac-2–positive macrophages (purple) and CD31-positive endothelial cells (ECs; green) in the intima, and signal is absent in miR-146a−/− mice. miR-146a expression during the progression of atherosclerosis is shown in Online Figure I. B, Schematic of the aorta, indicating the aortic root (examined in A), the greater curvature (GC, atheroprotective) and lesser curvature (LC, atherosusceptible) of the aortic arch and the descending thoracic aorta (DTA, atheroprotective). C, Expression of miR-146a (normalized to U6 levels) in the specified regions of the aorta in Ldlr−/− mice after 4 wk of HCD (n=5). Ldlr indicates low-density lipoprotein receptor.
Figure 2.
Figure 2.
Reduced atherosclerosis in mice with global deletion of microRNA-146a (miR-146a). A, Schematic of high cholesterol diet (HCD) regimen for Ldlr−/− and Ldlr−/−;miR-146a−/− (double knockout [DKO]) mice. B, Weights of male mice after 12- or 18-wk HCD (n=3–5). Weights of female mice were also unchanged between genotypes (not shown). C, Food consumption in mice (n=4 mice per cage). T0 is 18 wk of HCD. D, Percentage of Oil Red-O (ORO) regions quantified from aortic arches of Ldlr−/− and DKO mice after HCD for 12 or 18 wk. Representative images are shown to the right. The descending side of the aorta is to the right. Aortic root and descending thoracic aorta analyses are shown in Online Figure II. n=18 to 22 for 12-wk time point and n=4 for 18-wk time point. E, Circulating levels of proinflammatory markers, IL-6 (interleukin-6) and soluble intercellular adhesion molecule-1 (sICAM-1) in wild-type and DKO mice (n=5–8). F, Time course of plasma cholesterol measurements (n=3–5; 1 group of mice were used for weeks 1, 6, and 9, and a separate group was used for weeks 12 and 18). Mice were fasted overnight before sample collection. G, FPLC (fast protein liquid chromatography) trace of cholesterol content in lipoprotein fractions in plasma after 18 wk of HCD (pooled analysis of 5 samples). H, Intrahepatic cholesterol and triglyceride levels in mice after 12-wk HCD (n=13–14). Eighteen-week HCD is shown in Online Figure IID. Bile cholesterol (n=3) and fecal cholesterol (n=4) in mice after 18-wk HCD. I, Assessment of very-low-density lipoprotein (VLDL) secretion by measurement of triglycerides and cholesterol in plasma after injection of Poloxamer 407 (12-wk HCD; n=4, 2). Ldlr indicates low-density lipoprotein receptor.
Figure 3.
Figure 3.
MicroRNA-146a (miR-146a) in bone marrow (BM)–derived cells contributes to atherogenesis. A, Ldlr−/− mice lethally irradiated and given BM transplantation (BMT) from wild-type (WT BM) or miR-146a−/− (knockout [KO] BM) donors followed by high cholesterol diet (HCD) for 4 or 12 wk. B, Body weights of female mice after 12-wk HCD (n=5–7). Weights of male mice were also unchanged (not shown). C, Food consumption in mice (n=4 mice per cage). T0 is 12 wk of HCD. D, Percentage of Oil Red-O (ORO) regions per aortic arch measured by en face imaging after 4- or 12-wk HCD (n=9–11). Representative images of plaque burden in aortas of Ldlr−/− mice with WT BM (top) and KO BM (bottom) after 12-wk HCD are shown to the right. Aortic root and descending thoracic aorta analyses are shown in Online Figure IIIB and IIID. E, Circulating proinflammatory markers, soluble intercellular adhesion molecule-1 (sICAM-1), IL-6 (interleukin-6), and TNF-α (tumor necrosis factor-α), measured by ELISA of plasma samples (n=4–7). F, Time course of plasma cholesterol measurement in Ldlr−/− mice receiving WT or KO BM (n=4–7; 1 group of mice was used for weeks 0 and 4, and a separate group was used for week 12). G, FPLC (fast protein liquid chromatography) trace of cholesterol content of lipoprotein fractions from plasma after 12 wk of HCD (pooled analysis of 4 samples). H, Intrahepatic total cholesterol (TC), free cholesterol (FC), and triglycerides (TG) after 12-wk HCD (n=4). Fecal cholesterol levels after 12 wk of HCD (n=8). I, Expression of inflammatory genes, Sort1, and a macrophage marker (F4/80) from liver tissues. Shown is a heat map of quantitative reverse transcriptase-polymerase chain reaction data (n=4–8). Values are relative to the controls for each group, as indicated. *Significant difference in expression. J, TG measurements in the media of cultured primary mouse hepatocytes treated with recombinant mouse IL-6 for 6 h (n=4). K, The predicted miR-146a binding in the human and mouse SORT1 3′ UTR (untranslated region; above) and luciferase analyses in bovine aortic endothelial cells (BAECs; n=5). HDL indicates high-density lipoprotein; and Ldlr, low-density lipoprotein receptor.
Figure 4.
Figure 4.
Diet- and age-dependent splenomegaly in double knockout (DKO) mice. A, Spleen weight in Ldlr−/− or DKO mice after 12 or 18 wk of high cholesterol diet (HCD; n=12–16 for 12-wk HCD; n=5 for 18-wk HCD). B, Representative images of spleens and femurs in wild-type (WT) and KO bone marrow transplant (BMT) mice on HCD for 12 wk. C, Quantification of spleen weight in WT and KO BMT mice on HCD for 12 wk (n=5–7). D, Mice were placed on HCD or normal chow diet (NCD) at 20 wk of age for 12 wk. E, Percentage of Oil Red-O (ORO) region per aortic arch measured en face (n=3–4). Ldlr−/− mice on NCD were from a separate experiment and are included for comparison purposes (n=5). F, Representative images of spleens and femurs. G, Quantification of spleen weights (n=3–4). Ldlr−/− mice on NCD were from a separate experiment and are included for comparison purposes (n=5). H, Quantification of total CD45+ cells in spleens by fluorescence-activated cell sorting (FACS) analysis (n=3–4). Ldlr indicates low-density lipoprotein receptor.
Figure 5.
Figure 5.
Global loss of microRNA-146a (miR-146a) inhibits bone marrow (BM) hematopoiesis and promotes extramedullary hematopoiesis in the spleen. Increase of splenic (A) and decrease in BM (B) CD45+ leukocytes and Ly6G/CD115 lymphocytes in DKO mice on diet for 18 wk, determined by fluorescence-activated cell sorting (FACS) analysis (n=5). C, Decrease of multipotent progenitor cells (MPPs) and downstream progenitor cells (eg, Sca-1 [stem cells antigen-1]–negative progenitor [LSK], megakaryocyte–erythroid progenitor [MEP], common myeloid progenitor [CMP], and granulocyte–macrophage progenitor [GMP]) in BM of double knockout (DKO) mice after 18 wk of high cholesterol diet (HCD; n=5). D, Increase of splenic hematopoietic and multipotent stem cells in DKO mice after 18 wk of HCD (n=5; Online Figure VII). HPC indicates hematopoietic progenitors cell; HSC, hematopoietic stem cell; Ldlr, low-density lipoprotein receptor; and LSK, lineage- Sca-1+ Kit+.
Figure 6.
Figure 6.
MicroRNA-146a (miR-146a) in bone marrow (BM)–derived cells regulates BM and extramedullary hematopoiesis and levels of circulating leukocytes and lymphocytes. Lethally irradiated Ldlr−/− mice (mix of males and females) were reconstituted with BM from wild-type (WT BM) or miR-146a−/− (knockout [KO] BM) donors, followed by high cholesterol diet (HCD) for 12 wk. Increase of splenic (A) and a decrease of BM (B) leukocytes and lymphocytes, as assessed by fluorescence-activated cell sorting (FACS) analysis (n=5–7). C, Western blot of TRAF6 (TNF receptor–associated factor 6) and phospho-p65 (normalized to β-actin and total p65, respectively), in mice receiving WT or KO BM after 12 wk of HCD. Phospho-p65/p65 blots from WT/KO animals are from the same membrane with identical imaging parameters. D, Decrease of a subset of multipotent stem cells, but no changes to the long-term HSCs in the BM of mice receiving KO BM transplants (BMT; n=5–7). E, Increase of splenic hematopoietic and multipotent stem cells in mice receiving KO BM (n=5–7). F, Early monocytosis (4-wk HCD), followed by a decrease in peripheral blood (PB) proatherogenic cells (neutrophils, B Cells, and Ly6Chi monocytes), and an increase of antiatherogenic Ly6Clo monocytes after 12 wk of HCD (n=3 for 4-wk HCD; n=9–11 for 12-wk HCD). CMP indicates common myeloid progenitor; GMP, granulocyte–macrophage progenitor; HPC, hematopoietic progenitors cell; HSC, hematopoietic stem cell; Ldlr, low-density lipoprotein receptor; LSK, Sca-1 (stem cells antigen-1)–negative progenitor; MEP, megakaryocyte–erythroid progenitor; and MPP, multipotent progenitor cell.
Figure 7.
Figure 7.
MicroRNA-146a (miR-146a)–deficient cells seem to be outcompeted by wild-type (WT) cells in the bone marrow (BM), circulation, and in atherosclerotic plaques in high cholesterol diet (HCD)–treated animals, but not in normal chow diet (NCD)–treated animals. Competitive BM transplantation (BMT) was performed into Ldlr−/− recipients. A 1:1 mix of BM from WT (CD45.1) and knockout (KO; CD45.2) was used. A, Peripheral blood was analyzed by fluorescence-activated cell sorting (FACS) after NCD or HCD for 4, 12, or 32 wk (n=8, 5, 4, 2, respectively). Comparison was made between WT and KO within each time point. B, Cells in the aorta (B) and the BM (C) were analyzed by FACS in animals receiving NCD or HCD for 32 wk (n=2 per group). CMP indicates common myeloid progenitor; GMP, granulocyte–macrophage progenitor; HPC, hematopoietic progenitors cell; HSC, hematopoietic stem cell; Ldlr, low-density lipoprotein receptor; LSK, Sca-1 (stem cells antigen-1)–negative progenitor; MEP, megakaryocyte–erythroid progenitor; and MPP, multipotent progenitor cell.
Figure 8.
Figure 8.
MicroRNA-146a (miR-146a) in the vasculature restrains endothelial cell (EC) activation and atherosclerosis. A, Schematic of lethally irradiated Ldlr−/− or double knockout (DKO) mice given bone marrow transplantation (BMT) from wild-type (WT BM) donors followed by high cholesterol diet (HCD) for 12 wk. B, Circulating proinflammatory markers, soluble intercellular adhesion molecule-1 (sICAM-1), IL-6 (interleukin-6), and TNF-α (tumor necrosis factor-α), measured by ELISA (n=5–8). C, Circulating cholesterol, high-density lipoprotein (HDL), triglycerides (TG), low-density lipoprotein (LDL) and glucose levels after 12 wk of HCD (n=5). D, Quantification of spleen weight after 12 wk of HCD (n=12–15). E, Fluorescence-activated cell sorting (FACS) analysis of myeloid cells from spleen, BM, and peripheral blood (n=12–15). F, Gene expression in BM cells from BM transplanted animals (n=3–7). G, Percentage of Oil Red-O (ORO) region per aortic arch measured by en face staining (n=11–14). Representative images are shown to the right. Data on EC activation in the aorta are given in Online Figure VIII.

Comment in

References

    1. Hansson GK. Inflammation, atherosclerosis, and coronary artery disease. N Engl J Med. 2005;352:1685–1695. doi: 10.1056/NEJMra043430. - PubMed
    1. Weber C, Noels H. Atherosclerosis: current pathogenesis and therapeutic options. Nat Med. 2011;17:1410–1422. doi: 10.1038/nm.2538. - PubMed
    1. Gareus R, Kotsaki E, Xanthoulea S, van der Made I, Gijbels MJ, Kardakaris R, Polykratis A, Kollias G, de Winther MP, Pasparakis M. Endothelial cell-specific NF-kappaB inhibition protects mice from atherosclerosis. Cell Metab. 2008;8:372–383. doi: 10.1016/j.cmet.2008.08.016. - PubMed
    1. Kempe S, Kestler H, Lasar A, Wirth T. NF-kappaB controls the global pro-inflammatory response in endothelial cells: evidence for the regulation of a pro-atherogenic program. Nucleic Acids Res. 2005;33:5308–5319. doi: 10.1093/nar/gki836. - PMC - PubMed
    1. Cheng HS, Njock MS, Khyzha N, Dang LT, Fish JE. Noncoding RNAs regulate NF-κB signaling to modulate blood vessel inflammation. Front Genet. 2014;5:422. doi: 10.3389/fgene.2014.00422. - PMC - PubMed