. 2017 Jul 3;214(7):2005-2021.
doi: 10.1084/jem.20161418. Epub 2017 Jun 21.

Niche-mediated depletion of the normal hematopoietic stem cell reservoir by Flt3-ITD-induced myeloproliferation

Affiliations

Niche-mediated depletion of the normal hematopoietic stem cell reservoir by Flt3-ITD-induced myeloproliferation

Adam J Mead et al. J Exp Med. .

Abstract

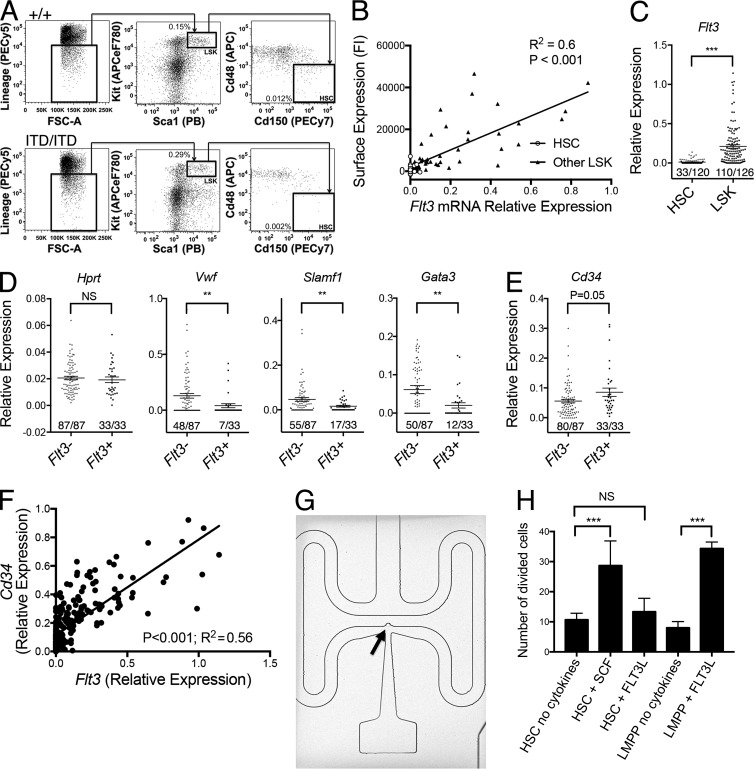
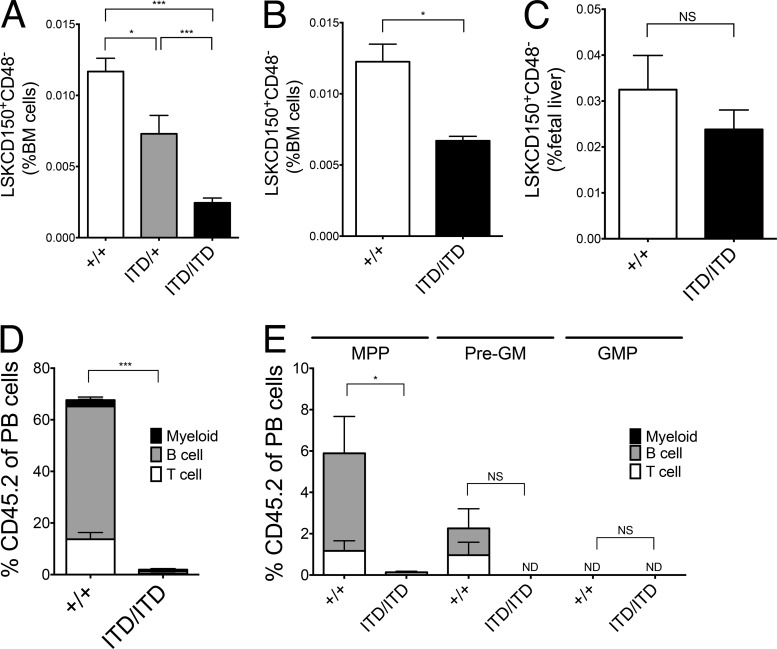
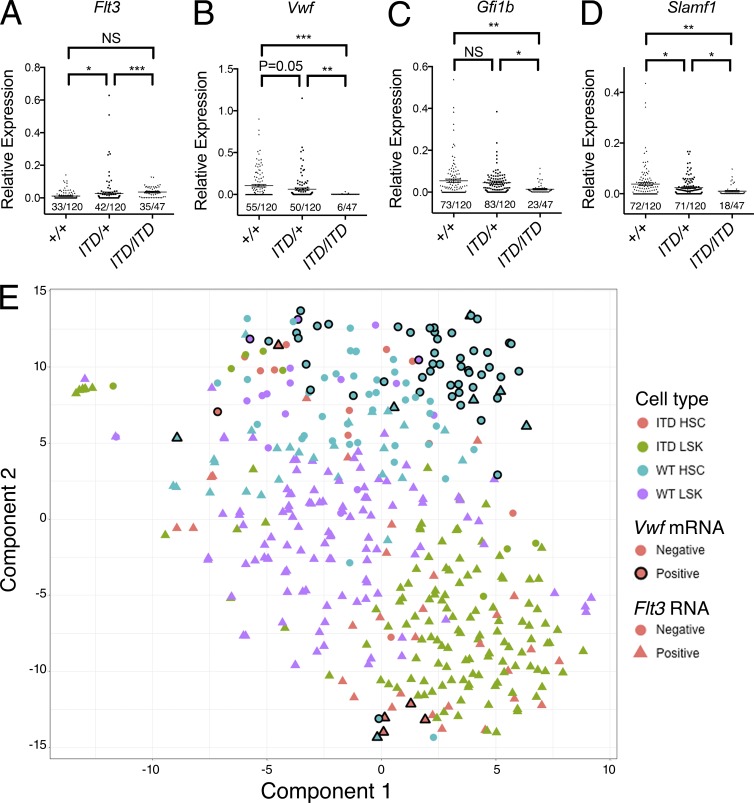
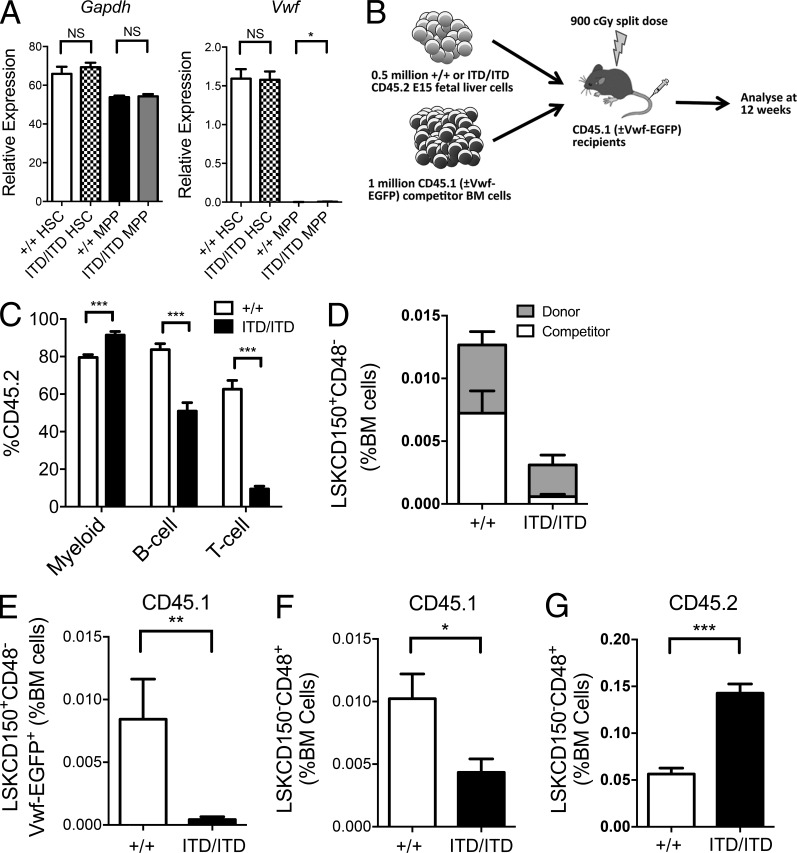
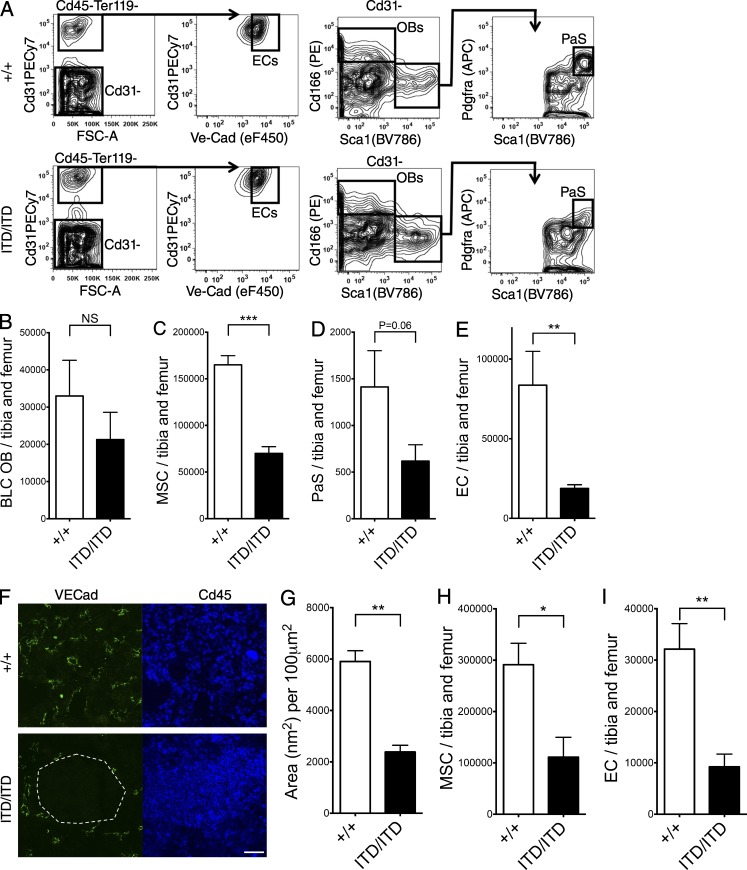
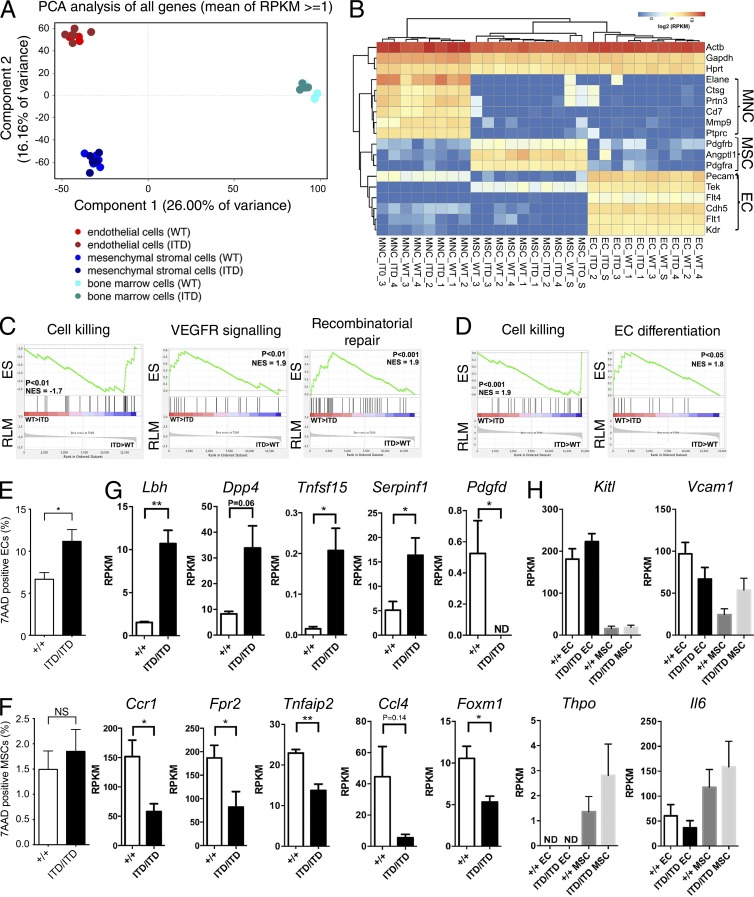
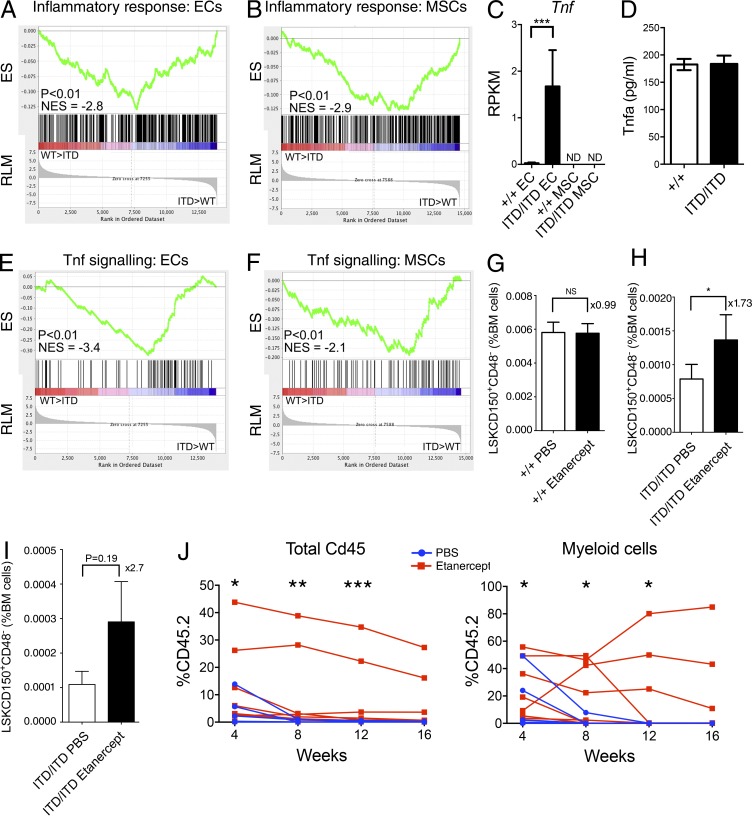
Although previous studies suggested that the expression of FMS-like tyrosine kinase 3 (Flt3) initiates downstream of mouse hematopoietic stem cells (HSCs), FLT3 internal tandem duplications (FLT3 ITDs) have recently been suggested to intrinsically suppress HSCs. Herein, single-cell interrogation found Flt3 mRNA expression to be absent in the large majority of phenotypic HSCs, with a strong negative correlation between Flt3 and HSC-associated gene expression. Flt3-ITD knock-in mice showed reduced numbers of phenotypic HSCs, with an even more severe loss of long-term repopulating HSCs, likely reflecting the presence of non-HSCs within the phenotypic HSC compartment. Competitive transplantation experiments established that Flt3-ITD compromises HSCs through an extrinsically mediated mechanism of disrupting HSC-supporting bone marrow stromal cells, with reduced numbers of endothelial and mesenchymal stromal cells showing increased inflammation-associated gene expression. Tumor necrosis factor (TNF), a cell-extrinsic potent negative regulator of HSCs, was overexpressed in bone marrow niche cells from FLT3-ITD mice, and anti-TNF treatment partially rescued the HSC phenotype. These findings, which establish that Flt3-ITD-driven myeloproliferation results in cell-extrinsic suppression of the normal HSC reservoir, are of relevance for several aspects of acute myeloid leukemia biology.


Figures

Figure 1.
Figure 1.
Single-cell analysis of the phenotypic HSC compartment. (A) Representative flow cytometry–based analysis and quantification of LSK cells and phenotypic (LSKCD150+CD48) HSCs in 8–10-wk-old Flt3+/+ and Flt3ITD/ITD mice. Shown are the mean values for the frequencies (percentage of total BM cells) of the indicated population across all experiments (+/+, n = 31 mice; ITD/ITD, n = 23 mice). (B) Correlation of Flt3 protein cell-surface expression (fluorescence intensity; FI) and Flt3 relative mRNA gene expression level in 28 phenotypic (LSKCD150+48) HSCs (open circles) and 62 single non-HSC LSK cells (filled triangles) from two 8-wk-old Flt3+/+ mice. P-value represents Pearson correlation coefficient. (C) Flt3 relative mRNA gene expression level in 120 LSKCD150+48 HSCs and 126 single non-HSC LSK cells from 8-wk-old Flt3+/+ mice (n = 5 mice). P-value at the top of the graph represents unpaired t test; the x/y figures beneath each dot plot indicate the number of cells demonstrating amplification for indicated gene (x) and total numbers of cells analyzed (y). (D) Relative mRNA gene expression level of Hprt, Vwf, Slamf1, and Gata3 in 120 LSKCD150+48 HSCs from 8-wk-old Flt3+/+ mice stratified according to presence (n = 33) or absence (n = 87) of Flt3 expression (n = 5 mice). (E) Relative mRNA gene expression level of Cd34 in 120 LSKCD150+48 HSCs from 8-wk-old Flt3+/+ mice stratified according to presence (n = 33) or absence (n = 87) of Flt3 expression (n = 5 mice). (F) Correlation of Flt3 and Cd34 relative mRNA gene expression level in 120 phenotypic HSCs and 126 single non-HSC LSKs from 8-wk-old Flt3+/+ mice (n = 5 mice). (G) Single mouse phenotypic HSC (arrow) captured in a 4.5-nl reaction chamber for single-cell gene expression analysis (representative image from one experiment). (H) Number of cells undergoing cell division after incubation of 180 single LSKCD150+48 HSCs or LSKFlt3high LMPPs under the indicated conditions for 5 d followed by culture in a full cytokine cocktail (see Materials and Methods) for a further 10 d. SCF indicates stem cell factor, and FLT3L indicates FLT3 ligand. Three independent experiments with 60 cells per experiment. P-values represent χ2 analysis comparing frequency of cells undergoing cell division of a total of 180 plated cells in the three experiments. Data are shown as mean (SEM) values. **, P < 0.01; ***, P < 0.001. NS, not significant.
Figure 2.
Figure 2.
Flt3-ITDs cause gene dosage–dependent and progressive suppression of BM HSCs. (A) Gene dosage–dependent reduction in LSKCD150+48 cells in 8–10-wk-old Flt3+/+, Flt3ITD/+, and Flt3ITD/ITD mice (+/+, n = 31; ITD/+, n = 14; ITD/ITD, n = 23). (B) Reduction in LSKCD150+48 cells in 2-wk-old Flt3ITD/ITD mice (+/+, n = 4; ITD/ITD, n = 6). (C) Numbers of phenotypic (LSKCD150+CD48) HSCs in E15 FL from Flt3+/+ and Flt3ITD/ITD mice (+/+, n = 8; ITD/ITD, n = 9). (D) Percentage CD45.2 chimerism in peripheral blood of recipient mice 16 wk after transplantation of 500,000 unfractionated CD45.2 BM cells and 200,000 CD45.1 WT competitor cells (eight to nine recipients per genotype in three experiments). (E) Percentage CD45.2 chimerism in BM of recipient (CD45.1) mice 16 wk after transplantation of 5,000 CD45.2 MPPs (LSKCD150CD48+), pre-GM (LinKit+Sca1CD41CD16/32CD150CD105), and GMPs (LinKit+Sca1CD41CD16/32+) together with 200,000 CD45.1 WT BM competitor cells (eight to nine recipients per genotype in two experiments). Data are shown as mean (SEM) values. *, P < 0.05; ***, P < 0.001 by t test. NS, not significant.
Figure 3.
Figure 3.
The cellular composition of the phenotypic HSC compartment is severely disrupted in Flt3-ITD mice. (A–D) Relative mRNA gene expression level for Flt3 (A), Vwf (B), Gfi1b (C), and Slamf1 (D) in LSKCD150+48 single cells from 8-wk-old Flt3+/+ (n = 120), Flt3ITD/+ (n = 120), and Flt3ITD/ITD (n = 47) mice (n = 3–5 mice for each genotype). The x/y figures beneath each dot plot indicate the number of cells demonstrating amplification for indicated gene (x) and total numbers of cells analyzed (y). (E) t-SNE analysis demonstrating distinct clustering of HSCs and total LSK cells from Flt3+/+ and Flt3ITD/ITD mice. Color of each point indicates cell type: red, Flt3ITD/ITD HSC (n = 47); green, Flt3ITD/ITD LSK (n = 133); blue, Flt3+/+ HSC (n = 120); and purple, Flt3+/+ LSK (n = 126). Presence (triangles) or absence (circles) of Flt3 mRNA and presence (black border) or absence (no border) of Vwf mRNA is also indicated. The large majority of phenotypic HSCs from Flt3ITD/ITD mice cluster together with LSK progenitor cells and are clearly separated from Vwf mRNA–positive Flt3+/+ HSCs. Data are shown as mean (SEM) values. *, P < 0.05; **, P < 0.01; ***, P < 0.001 by t test. NS, not significant.
Figure 4.
Figure 4.
Flt3-ITDs cause cell-extrinsic suppression of BM HSCs. (A) Relative mRNA gene expression (normalized to Hprt) of Gapdh and Vwf in E15 fetal liver phenotypic HSCs (LSKCD150+CD48) and MPPs (LSKCD150CD48+) from Flt3+/+ and Flt3ITD/ITD mice (n = 9 replicates from three mice per genotype). (B) Experimental design for competitive transplantation experiments. (C) Analysis of engraftment 12 wk after transplantation of 5 × 10⁵ CD45.2 E15 FL cells (Flt3+/+ or Flt3ITD/ITD) into CD45.1 recipients with 106 WT CD45.1 BM competitor cells (four donor FL of each genotype transplanted into two to three recipients in two experiments). Results are expressed as percentage of cells expressing CD45.2 of each lineage, myeloid (Mac1+), B cell (B220+CD19+), and T cell (CD4+ and/or CD8+), in the peripheral blood 12 wk after transplantation. (D) Percentage (of total BM cells) of donor (CD45.2) and competitor (CD45.1) HSCs (LSKCD150+CD48) in BM of recipient mice 12 wk after transplantation (four donor FL of each genotype transplanted into two to three recipients in two experiments). (E) Percentage competitor Vwf-EGFP+ HSCs (LSKCD150+CD48Vwf-EGFP+CD45.1) in BM of recipient mice 12 wk after transplantation, expressed as percentage of total BM cells. (F and G) Percentage (of total BM cells) of competitor (CD45.1; F) or donor (CD45.2; G) MPPs (LSKCD150CD48+) in BM of recipient mice 12 wk after transplantation (four donor FL of each genotype each transplanted into two to three recipients in two experiments). Data are shown as mean (SEM) values. *, P < 0.05; **, P < 0.01; ***, P < 0.001 by t test. NS, not significant.
Figure 5.
Figure 5.
Flt3-ITD–induced myeloproliferation disrupts the vascular HSC niche. (A) Representative gating strategy to identify osteoblasts (OBs; CD45Ter119CD31CD166+Sca1), PaS MSCs (CD45Ter119CD31CD166Sca1+Pdgfra+), and ECs (CD45Ter119CD31+VE-Cadherin+) in BLCs from Flt3+/+ and Flt3ITD/ITD mice. (B–E) FACS quantification of OBs in the BLC of 8–10-wk-old Flt3+/+ and Flt3ITD/ITD mice (11 and 13 mice per genotype, respectively; B), MSCs (C) and PaS MSCs (D) in the BLC, and ECs in the BLC and BM (E) of 8–10-wk-old Flt3+/+ and Flt3ITD/ITD mice (six and seven mice per genotype, respectively). (F) Representative images of Flt3+/+ and Flt3ITD/ITD BM in which ECs are identified by VE-cadherin and hematopoietic cells by CD45 staining. An area devoid of vasculature and entirely replaced by CD45+ Flt3ITD/ITD hematopoietic cells is highlighted by the white dashed line. Bar, 50 µm. (G) Sum of blood vessel areas in Flt3+/+ and Flt3ITD/ITD mouse BM (n = 15 areas from three mice of each genotype). (H and I) Numbers of MSCs (H) and ECs (I) in recipient mice 12 wk after transplantation of 5 × 10⁵ CD45.2 E15 FL cells (Flt3+/+ or Flt3ITD/ITD) into CD45.1 WT recipients with 106 WT CD45.1 BM competitor cells (two donor FL of each genotype transplanted into two to three recipients in two experiments). Data are shown as mean (SEM) values. *, P < 0.05; **, P < 0.01; ***, P < 0.001 by t test. NS, not significant.
Figure 6.
Figure 6.
Molecular features of niche elements in Flt3-ITD mice. BM MNCs, ECs (CD45Ter119CD31+), and MSCs (CD45Ter119CD31CD166Sca1+) from Flt3+/+ and Flt3ITD/ITD 8–10-wk-old mice (four to five mice per genotype) were subjected to global RNA sequencing. (A) Principal component analysis of MNCs, ECs, and MSCs from Flt3+/+ and Flt3ITD/ITD mice. Each dot represents the indicated cell population from one mouse. (B) Expression of hematopoietic, endothelial, and MSC-associated genes in purified populations of MNCs, ECs, and MSCs from Flt3+/+ and Flt3ITD/ITD 8–10-wk-old mice (four to five mice per genotype). (C) GSEA comparing ECs from Flt3+/+ and Flt3ITD/ITD mice for genes involved in regulation of cell killing and regulation of vascular endothelial growth factor receptor signaling pathway and DNA repair (five mice per genotype). (D) GSEA genes comparing MSCs from Flt3+/+ and Flt3ITD/ITD mice for genes involved in regulation of cell killing and regulation of endothelial cell differentiation (five mice per genotype). (E and F) Frequency of 7AAD-positive ECs (E) and MSCs (F) in the BLC of 8–10-wk-old Flt3+/+ and Flt3ITD/ITD mice (six and seven mice per genotype, respectively). (G) Aberrant expression of angiogenesis-associated genes in MNCs from Flt3ITD/ITD mice (four mice per genotype). (H) Expression of genes implicated in extrinsic regulation of HSCs in EC and MSC from Flt3+/+ and Flt3ITD/ITD mice (five mice per genotype). Data are shown as mean (SEM) values. *, P < 0.05; **, P < 0.01 by t test. ND, not detected; NS, not significant.
Figure 7.
Figure 7.
Aberrant inflammation and TNF signaling cause HSC suppression in Flt3-ITD mice. (A and B) GSEA comparing ECs (A) and MSCs (B) in Flt3+/+ and Flt3ITD/ITD mice for inflammatory response–associated gene expression (five mice per genotype in two experiments). (C) Increased expression of Tnf in ECs from Flt3ITD/ITD mice (five mice per genotype). Adjusted p-value from edgeR analysis is shown. (D) Serum TNF-α levels in Flt3+/+ and Flt3ITD/ITD 8–10-wk-old mice (two to three mice per genotype). (E and F) GSEA comparing ECs (E) and MSCs (F) in Flt3+/+ and Flt3ITD/ITD mice for TNF signaling–associated gene expression (five mice per genotype). (G and H) Impact of 3 wk of etanercept treatment on numbers (percentage of total BM cells) of phenotypic (LSKCD150+CD48) HSCs in Flt3+/+ (G) and Flt3ITD/ITD (H) mice (n = 6–7 mice per group in two independent experiments). (I) Impact of etanercept treatment (compared with PBS treatment) on numbers of phenotypic competitor HSCs (CD45.1+LSKCD150+CD48) in recipient mice 12 wk after transplantation of 5 × 10⁵ CD45.2 E15 FL cells (Flt3ITD/ITD) into CD45.1 WT recipients with 106 WT CD45.1 BM competitor cells. Data are shown as mean (SEM) values (n = 6 mice per treatment group, two independent experiments). (J) Serial analysis of percentage CD45.2 chimerism in peripheral blood of recipient mice after transplantation of 500,000 unfractionated CD45.2 BM cells from Flt3ITD/ITD mice after 3 wk of treatment with PBS or etanercept (n = 9 mice per treatment group in two experiments). WT CD45.1 competitor cells (n = 200,000) were cotransplanted. Data are shown for total PBMCs (left) and Mac1+Gr1 myeloid cells (right). P-values were generated using Mann–Whitney test to compare percentage of CD45.2 across all replicates for each time point. *, P < 0.05; **, P < 0.01; ***, P < 0.001. ND, not detected; NS, not significant.

References

    1. Adolfsson J., Borge O.J., Bryder D., Theilgaard-Mönch K., Astrand-Grundström I., Sitnicka E., Sasaki Y., and Jacobsen S.E.. 2001. Upregulation of Flt3 expression within the bone marrow Lin(-)Sca1(+)c-kit(+) stem cell compartment is accompanied by loss of self-renewal capacity. Immunity. 15:659–669. 10.1016/S1074-7613(01)00220-5 - DOI - PubMed
    1. Adolfsson J., Månsson R., Buza-Vidas N., Hultquist A., Liuba K., Jensen C.T., Bryder D., Yang L., Borge O.J., Thoren L.A., et al. . 2005. Identification of Flt3+ lympho-myeloid stem cells lacking erythro-megakaryocytic potential a revised road map for adult blood lineage commitment. Cell. 121:295–306. 10.1016/j.cell.2005.02.013 - DOI - PubMed
    1. Anders S., and Huber W.. 2010. Differential expression analysis for sequence count data. Genome Biol. 11:R106 10.1186/gb-2010-11-10-r106 - DOI - PMC - PubMed
    1. Böiers C., Buza-Vidas N., Jensen C.T., Pronk C.J., Kharazi S., Wittmann L., Sitnicka E., Hultquist A., and Jacobsen S.E.. 2010. Expression and role of FLT3 in regulation of the earliest stage of normal granulocyte-monocyte progenitor development. Blood. 115:5061–5068. 10.1182/blood-2009-12-258756 - DOI - PubMed
    1. Böiers C., Carrelha J., Lutteropp M., Luc S., Green J.C., Azzoni E., Woll P.S., Mead A.J., Hultquist A., Swiers G., et al. . 2013. Lymphomyeloid contribution of an immune-restricted progenitor emerging prior to definitive hematopoietic stem cells. Cell Stem Cell. 13:535–548. 10.1016/j.stem.2013.08.012 - DOI - PubMed

MeSH terms