. 2017 Jun 21;7(1):3962.
doi: 10.1038/s41598-017-04271-x.

Hard X-rays as pump and probe of atomic motion in oxide glasses

Affiliations

Hard X-rays as pump and probe of atomic motion in oxide glasses

B Ruta et al. Sci Rep. .

Abstract

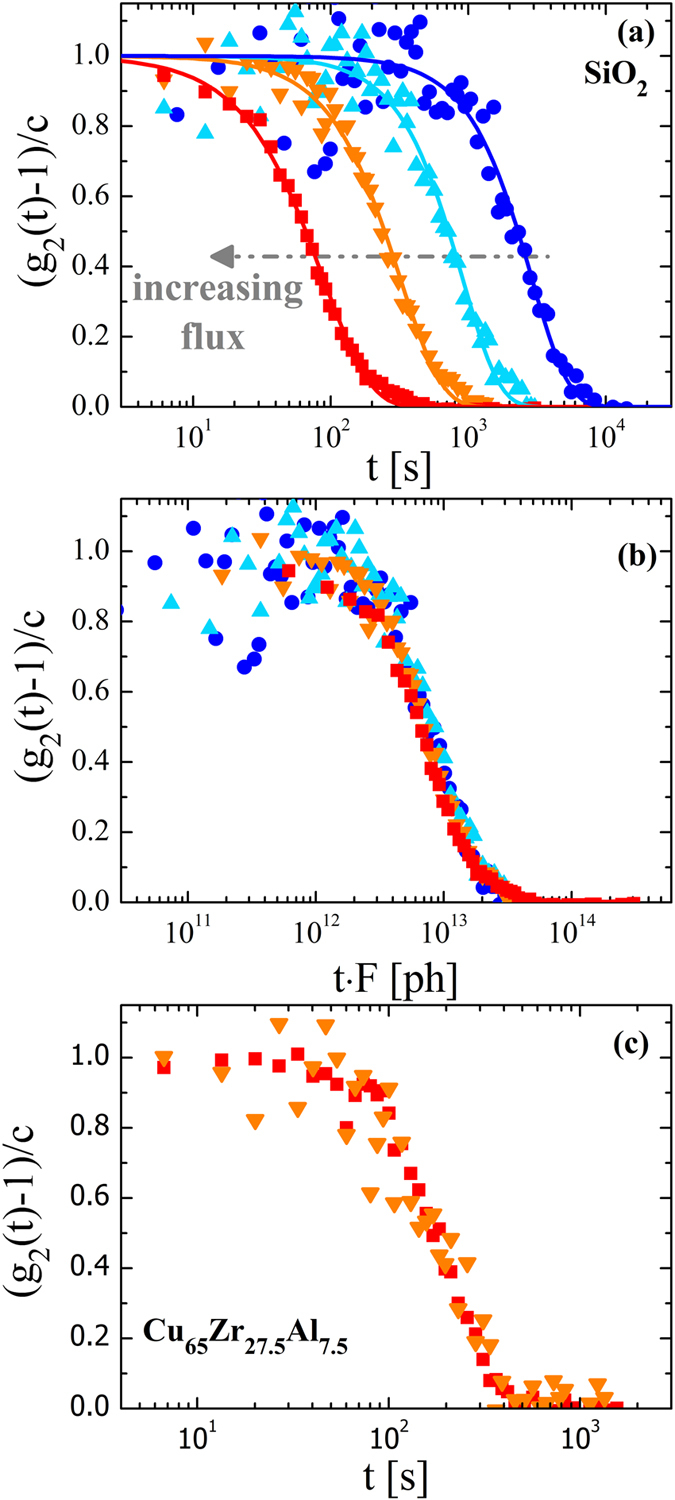
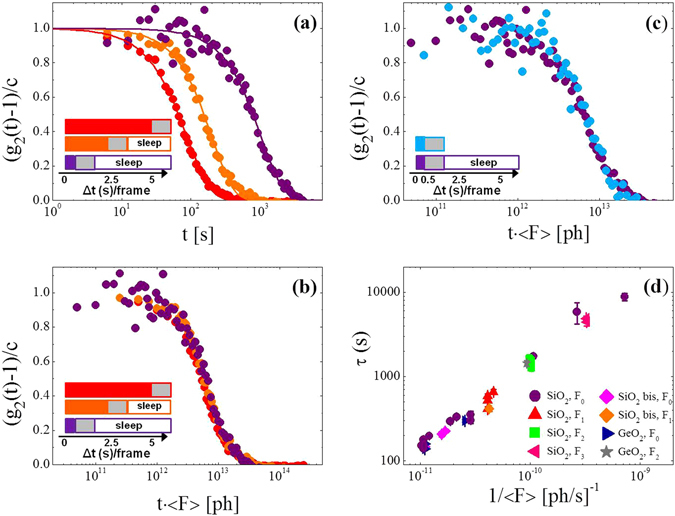
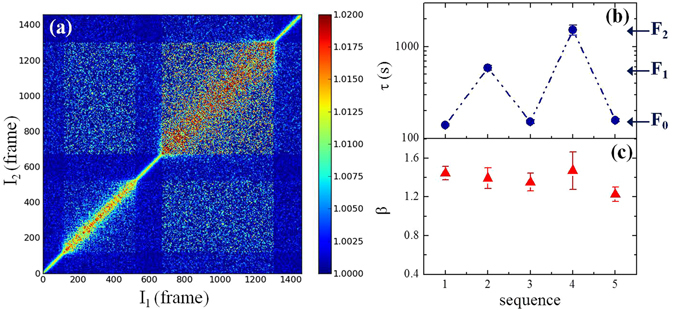
Nowadays powerful X-ray sources like synchrotrons and free-electron lasers are considered as ultimate tools for probing microscopic properties in materials. However, the correct interpretation of such experiments requires a good understanding on how the beam affects the properties of the sample, knowledge that is currently lacking for intense X-rays. Here we use X-ray photon correlation spectroscopy to probe static and dynamic properties of oxide and metallic glasses. We find that although the structure does not depend on the flux, strong fluxes do induce a non-trivial microscopic motion in oxide glasses, whereas no such dependence is found for metallic glasses. These results show that high fluxes can alter dynamical properties in hard materials, an effect that needs to be considered in the analysis of X-ray data but which also gives novel possibilities to study materials properties since the beam can not only be used to probe the dynamics but also to pump it.


Conflict of interest statement

The authors declare that they have no competing interests.

Figures

Figure 1
Figure 1
Relaxation dynamics of the atoms as a function of the incident X-ray beam intensity. (a) Normalized intensity auto-correlation functions measured in vitreous silica at T = 295 K and wave-vector Qp = 1.5 Å−1 for different intensities of the flux of the X-ray beam. From left to right: F0 ≈ 1 · 1011 ph/s (red squares), F1 ≈ 3 · 1010 ph/s (orange down-triangles), F2 ≈ 1.2 · 1010 ph/s (cyan up-triangles) and F3 ≈ 3.6 · 109 ph/s (blue circles). Lines are fits with a Kohlrausch-Williams-Watts function. The corresponding decay times are reported in Fig. 2d while the shape parameter β is found to be ~1.4 ± 0.1, independent on the incoming flux. (b) Same data rescaled by the incoming flux. (c) Normalized intensity auto-correlation functions measured in Cu65Zr27.5Al7.5 metallic glass at T = 413 K and Qp = 2.5 Å−1 for F0 ≈ 1 · 1011 ph/s (red squares), and F1 ≈ 3 · 101 ph/s (orange down-triangles).
Figure 2
Figure 2
Tuning of the atomic motion. (a) Normalized intensity auto-correlation functions measured in vitreous silica at T = 295 K and Qp = 1.5 Å−1 with fixed lagtime per frame, Δt = 6.15 s, but with different sleeping times Δts and exposure times Δte. From left to right: Δte = 5 s and Δts = 0 s (red), Δte = 2.5 s and Δts = 2.5 s (orange), Δte = 0.5 s and Δts = 4.5 s (purple). The legend illustrates the acquisition mode per frame with full coloured boxes for the exposure times Δte (beam on), empty boxes both for the sleeping times Δts (beam off) and the constant readout time of the CCD Δtr (beam off, grey boxes). (b) Same data as in panel (a) but now normalized by the mean flux <F> = FΔte/Δt. (c) (g2(t) − 1)/c measured with Δte = 0.5 s and Δts = 4.5 s (same purple data as in panel (a) reported as a function of the time t times the mean flux. The data are compared with the g2(t) measured with the same exposure time Δte = 0.5 s and no sleeping time (Δts = 0 s, cyan). (d) Decay time for different combinations of the incident flux and the lagtime. The data are shown as a function of the inverse mean flux. Also included is data for a second SiO2 sample (SiO2 bis) and for vitreous GeO2. The legend indicates the flux used for each set of measurements.
Figure 3
Figure 3
Instantaneous, reversible and stationary dynamics. (a) Two-time correlation function measured in vitreous silica at T = 295 K and Qp = 1.5 Å−1 by varying the intensity of the incoming flux. Left to right in frame number: F0 ≈ 1 · 1011 ph/s, F1 ≈ 3 · 1010 ph/s, F0 ≈ 1 · 1011 ph/s, F2 ≈ 1.2 · 1010 ph/s, and F0 ≈ 1 · 1011 ph/s. Each frame corresponds to Δt = 6.15 s. (b) Characteristic decay times τ as a function of the flux intensities used in panel (a). (c) Shape parameters β as a function of the flux intensities used in panel (a).
Figure 4
Figure 4
Wave-vector dependence of the X-ray induced dynamics. Wave-vector dependence of the characteristic decay time in vitreous silica measured at T = 295 K and for F0 ≈ 1 · 1011 ph/s (red circles). The grey triangles are taken with F1 ≈ 3 · 1010 ph/s and rescaled by the factor 2.74 corresponding to the X-ray intensity difference between the two measurements.

References

    1. Neutron and Synchrotron Radiation for Condensed Matter Studies (eds. Baruchel, J. et al.), (Springer, 1994).
    1. Wang J, et al. Radiation damage in soft X-ray microscopy. J. Electron. Spectrosc. Relat. Phenom. 2009;170:25. doi: 10.1016/j.elspec.2008.01.002. - DOI
    1. Ravelli RBG, McSweeney SM. The ‘fingerprint’ that X-rays can leave on structures. Structure. 2000;8:315. doi: 10.1016/S0969-2126(00)00109-X. - DOI - PubMed
    1. Teng T, Moffat K. Primary radiation damage of protein crystals by an intense synchrotron X-ray beam. J. Synch. Rad. 2000;7:313. doi: 10.1107/S0909049500008694. - DOI - PubMed
    1. Gonzalez A, Nave C. Radiation damage in protein crystals at low temperature. Acta Cryst. D. 1994;50:874–877. doi: 10.1107/S0907444994006311. - DOI - PubMed