. 2017 Jun 21;7(1):4017.
doi: 10.1038/s41598-017-03907-2.

Global profiling of phytohormone dynamics during combined drought and pathogen stress in Arabidopsis thaliana reveals ABA and JA as major regulators

Affiliations

Global profiling of phytohormone dynamics during combined drought and pathogen stress in Arabidopsis thaliana reveals ABA and JA as major regulators

Aarti Gupta et al. Sci Rep. .

Abstract

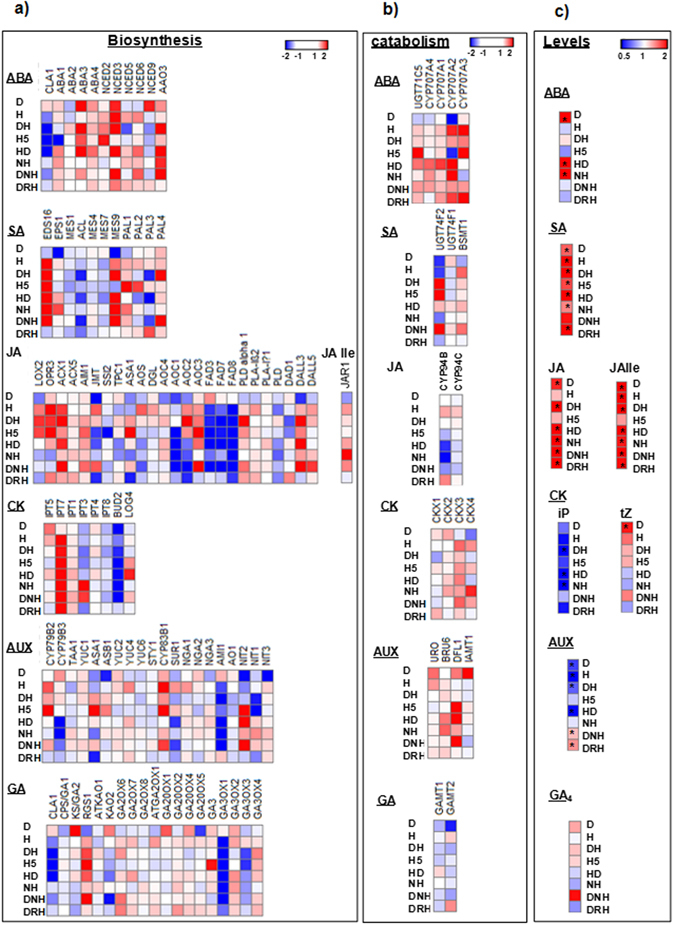
Global transcriptome studies demonstrated the existence of unique plant responses under combined stress which are otherwise not seen during individual stresses. In order to combat combined stress plants use signaling pathways and 'cross talk' mediated by hormones involved in stress and growth related processes. However, interactions among hormones' pathways in combined stressed plants are not yet known. Here we studied dynamics of different hormones under individual and combined drought and pathogen infection in Arabidopsis thaliana by liquid chromatography-mass spectrometry (LC-MS) based profiling. Our results revealed abscisic acid (ABA) and salicylic acid (SA) as key regulators under individual drought and pathogen stress respectively. Under combined drought and host pathogen stress (DH) we observed non-induced levels of ABA with an upsurge in SA and jasmonic acid (JA) concentrations, underscoring their role in basal tolerance against host pathogen. Under a non-host pathogen interaction with drought (DNH) stressed plants, ABA, SA and JA profiles were similar to those under DH or non-host pathogen alone. We propose that plants use SA/JA dependent signaling during DH stress which antagonize ABA biosynthesis and signaling pathways during early stage of stress. The study provides insights into hormone modulation at different time points during combined stress.


Conflict of interest statement

The authors declare that they have no competing interests.

Figures

Figure 1
Figure 1
Modulation in phytohormones levels in leaves of Arabidopsis thaliana exposed to individual and combined stresses. Leaf samples were harvested at 8 hours post pathogen inoculation/combined stress treatment (hpt), lyophilized and were used for LC-MS based phytohormone quantification. Plants were subjected to drought (D), host pathogen (H, Pseudomonas syringae pv. tomato DC3000) or H5 (host pathogen treatment for 4.8 days), non-host pathogen (NH),combined drought followed by pathogen (DH) or non-host pathogen (DNH), combined pathogen followed by drought stress (HD), combined drought or pathogen infection during drought recovery (DRH) along with their respective controls (D over absolute or H, H5, NH, DH, HD, DNH and DRH over mock control). All leaves were used to quantify hormone concentrations. Absolute levels of ABA (a), SA (b), JA (c) and JA-Ile (d) are presented in terms of ng/g dry weight of the samples. Each data point represents the mean of at least three independent replicates and error bars denote standard error of mean. Significant difference in hormone levels in individual drought stressed samples was assessed over absolute control. Significant difference in hormone levels in individual H, H5, NH or combined HD, DNH and DRH treatments was assessed over mock control. Significant difference between different treatments and controls was analyzed by student’s t-test. Asterix represent significant difference between treatment and control at p < 0.05. Comparison among individual and combined stresses is presented in terms of fold change over their respective controls in Supplementary Figs S4–S6. Raw values for phytohormone concentrations at 2, 8 and 24 hpt, number of replicates and calculated standard error of mean over respective controls are presented in Supplementary File S1.
Figure 2
Figure 2
Transcript expression pattern of hormone biosynthesis related genes and hormone levels in A. thaliana under individual and combined stresses. Transcriptome analysis of hormone biosynthesis and catabolism related genes was correlated with endogenous phytohormone concentrations at 24 hpt under different individual and combined stress treatments. Heat maps reflect transcript expression pattern of phytohormone biosynthesis (a) and catabolism (b) associated genes. Previously, A. thaliana plants were exposed to different stress treatments (same as the one used in present study) and leaf samples were harvested at 24 hpt. Microarray experiment was conducted with these samples and microarray data was submitted to GEO NCBI (accession no. GSE79681). Differentially expressed genes were identified in stressed samples over control using Expression Console and Transcriptome Analysis Console (Affymetrix, California, USA). Genes involved in hormone biosynthesis and catabolism were identified through manual curation in literature and Arabidopsis Hormone Database 2.0 (http://ahd.cbi.pku.edu.cn/). Full details of genes names and corresponding ID are provided in Supplementary File S2. Heatmaps presented in (c) indicate fold change in hormone levels under different treatments over control at 24 hpt. Significant difference in treatments over control was calculated using Student’s t-test and *indicates significant change in hormone levels over control at p ≤ 0.05. Color bar ranging from red to blue represents up-regulation and down-regulation in transcript expression or phytohormone concentrations. Raw values of phytohormone profile with standard error of means and number of replicates are mentioned in Supplementary File S1. D; drought, H; host pathogen Pst DC3000, DH; combined drought and host pathogen stress, H5; host pathogen Pst DC3000 infection for 5 days, HD; combined host pathogen and drought stress, NH; non-host Psta, DNH; combined drought and non-host, DRH; combined drought recovery host pathogen stress.
Figure 3
Figure 3
Validation of transcript expression pattern by RT-qPCR. Transcript expression profile of key genes involved in hormone biosynthesis obtained from microarray experiment was validated by RT-qPCR. Graph represents relative expression of the genes under combined DH stress. Bar and line graphs represent expression profile obtained from RT-qPCR and microarray experiments respectively. In RT-qPCR experiment, AtActin2 was used as reference gene for data normalization. Fold change was calculated over mock control. Each bar represents average of four biological and two technical replicates ± SEM.
Figure 4
Figure 4
Schematic diagram illustrating the hormonal network under individual drought and host pathogen and their combination. The hormone and transcriptome profile data was integrated to redraw the model from Atkinson and Urwin (2012). The diagram depicts crosstalk between different hormones during individual and combined stress. The role of plant hormones in regulating the interaction between biotic and abiotic stress is presented based on individual stress data (a). The role of plant hormones in regulating combined drought and host pathogen stress (DH) is presented based on combined stress data (b). Red color boxes indicate elevation in hormone content and white boxes indicate no change over control. Green arrows show induction or positive regulation, while yellow bars show inhibition or repression of gene or process. The crosstalk between abiotic and biotic stress response is shown as dashed arrows or bars. Cross signs represent inhibition of the step in absence of hormone or its signaling. Pattern of gene expression is shown in the form of heatmap where red color shows up- and blue color shows down-regulation. ABA, abscisic acid; JA, jasmonic acid; SA, salicylic acid; PR, pathogenesis-related; SAR, systemic acquired resistance.

References

    1. Ramegowda V, Senthil-Kumar M. The interactive effects of simultaneous biotic and abiotic stresses on plants: Mechanistic understanding from drought and pathogen combination. J. Plant Physiol. 2014;176C:47–54. - PubMed
    1. Pandey P, Ramegowda V, Senthil-Kumar M. Shared and unique responses of plants to multiple individual stresses and stress combinations: physiological and molecular mechanisms. Front. Plant Sci. 2015;6:1–14. doi: 10.3389/fpls.2015.00723. - DOI - PMC - PubMed
    1. Suzuki N, Rivero RM, Shulaev V, Blumwald E, Mittler R. Tansley review Abiotic and biotic stress combinations. New Phytol. 2014;203:32–43. doi: 10.1111/nph.12797. - DOI - PubMed
    1. Ramegowda V, et al. Drought stress acclimation imparts tolerance to Sclerotinia sclerotiorum and Pseudomonas syringae in Nicotiana benthamiana. Int. J. Mol. Sci. 2013;14:9497–9513. doi: 10.3390/ijms14059497. - DOI - PMC - PubMed
    1. Sinha R, Gupta A, Senthil-Kumar M. Understanding the impact of drought on foliar and xylem invading bacterial pathogen stress in chickpea. Front. Plant Sci. 2016;7:902. - PMC - PubMed

Publication types