

Neonates with cancer and causes of death; lessons from 615 cases in the SEER databases
- PMID: 28639735
- PMCID: PMC5504346
- DOI: 10.1002/cam4.1122
Neonates with cancer and causes of death; lessons from 615 cases in the SEER databases
Abstract
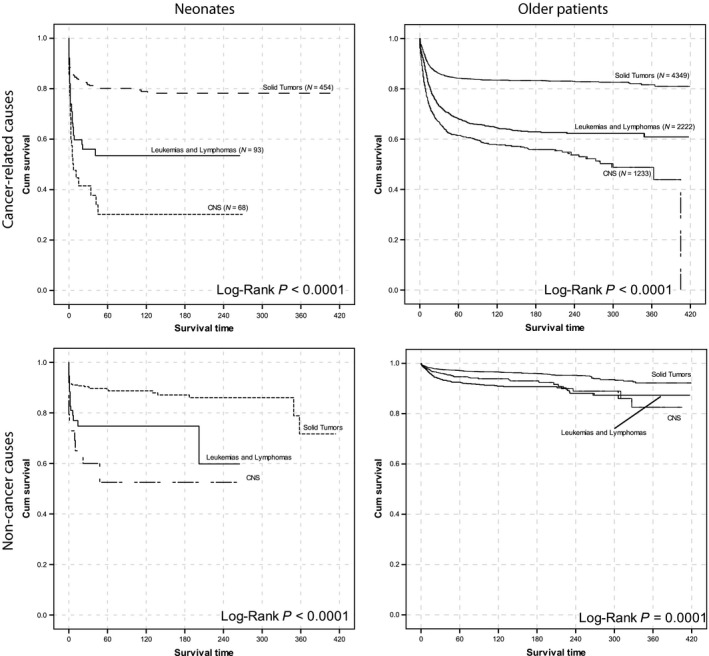
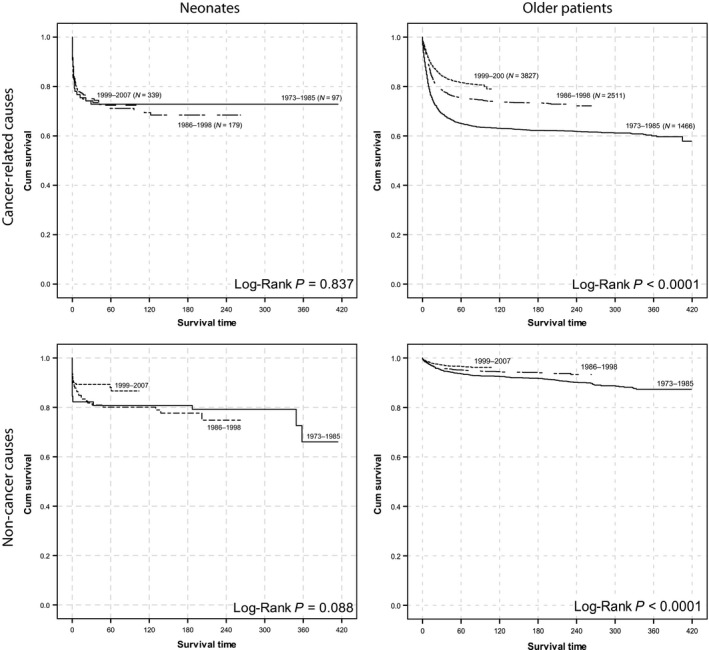
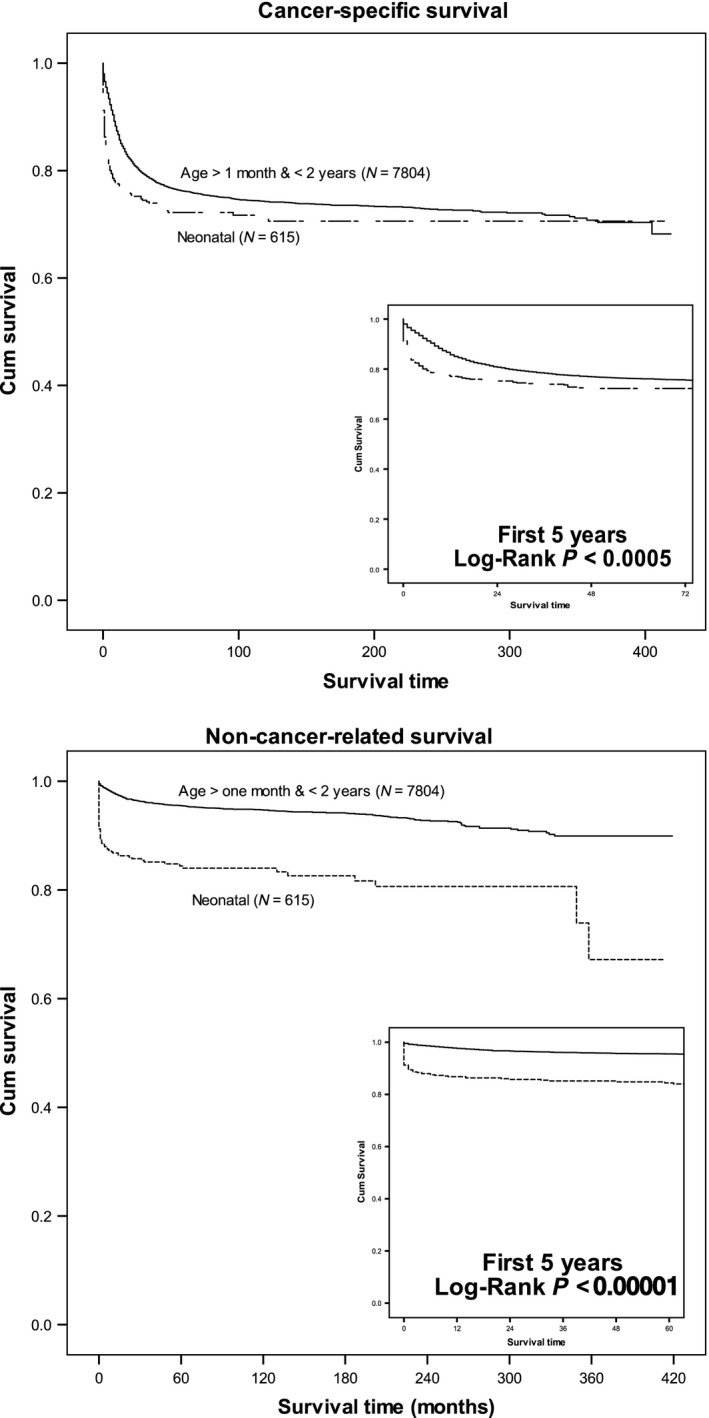
Neonatal tumors are rare with no standard treatment approaches to these diseases, and the patients experience poor outcomes. Our aim was to determine the distribution of cancers affecting neonates and compare survival between these cancers and older children. We analyzed SEER data (1973-2007) from patients who were younger than 2 years at diagnosis of malignancy. Special permission was granted to access the detailed (i.e., age in months) data of those patients. The Chi-square Log-rank test was used to compare survival between neonates (aged <1 month) and older children (>1 month to <2 years). We identified 615 neonatal cancers (454 solid tumors, 93 leukemia/lymphoma, and 68 CNS neoplasms). Neuroblastoma was the most common neonatal tumor followed by Germ cell tumors. The 5-year overall survival (OS) for all neonates was 60.3% (95% CI, 56.2-64.4). Neonates with solid tumors had the highest 5-year OS (71.2%; 95% CI, 66.9-75.5), followed by those with leukemia (39.1%; 95% CI, 28.3-49.9) or CNS tumors (15%; 95% CI, 5.4-24.6). Except for neuroblastoma, all neonatal tumors showed inferior outcomes compared to that in the older group. The proportion of neonates who died from causes other than cancer was significantly higher than that of the older children (37.9% vs. 16.4%; P < 0.0005). In general, the outcome of neonatal cancers has not improved over the last 34 years. The distribution of neonatal cancer is different than other pediatric age groups. Although the progress in neonatal and cancer care over the last 30 years, only death from noncancer causes showed improvement. Studying neonatal tumors as part of national studies is essential to understand their etiology, determine the best treatment approaches, and improve survival and quality of life for those patients.
Keywords: Epidemiology; SEER; infancy; neonatal tumors; undertreatment.
© 2017 The Authors. Cancer Medicine published by John Wiley & Sons Ltd.
Figures
References
-
- Moore, S. W. , Satgé D., Sasco A. J., Zimmermann A., and Plaschkes J.. 2003. The epidemiology of neonatal tumours. Report of an international working group. Pediatr. Surg. Int. 19:509–519. - PubMed
-
- Orbach, D. , Sarnacki S., Brisse H. J., Gauthier‐Villars M., Jarreau P. H., Tsatsaris V., et al. 2013. Neonatal cancer. Lancet Oncol. 14:e609–20. - PubMed
-
- Moore, S. W. 2013. Neonatal tumours. Pediatr. Surg. Int. 29:1217–1229. - PubMed
-
- Vormoor, J. , and Chintagumpala M.. 2012. Leukaemia & cancer in neonates. Semin. Fetal Neonatal. Med. 17:183–184. - PubMed
-
- Isaacs, H. 1987. Congenital and Neonatal Malignant Tumors. Am. J. Pediatr. Hematol. Oncol. 9:121–129. - PubMed
MeSH terms
Grants and funding
LinkOut - more resources
Full Text Sources
Other Literature Sources
Medical
