

In-scan and scan-rescan assessment of LV in- and outflow volumes by 4D flow MRI versus 2D planimetry
- PMID: 28640394
- PMCID: PMC5811894
- DOI: 10.1002/jmri.25792
In-scan and scan-rescan assessment of LV in- and outflow volumes by 4D flow MRI versus 2D planimetry
Abstract
Purpose: To evaluate the in-scan and scan-rescan consistency of left ventricular (LV) in- and outflow assessment from 1) 2D planimetry; 2) 4D flow magnetic resonance imaging (MRI) with retrospective valve tracking, and 3) 4D flow MRI with particle tracing.
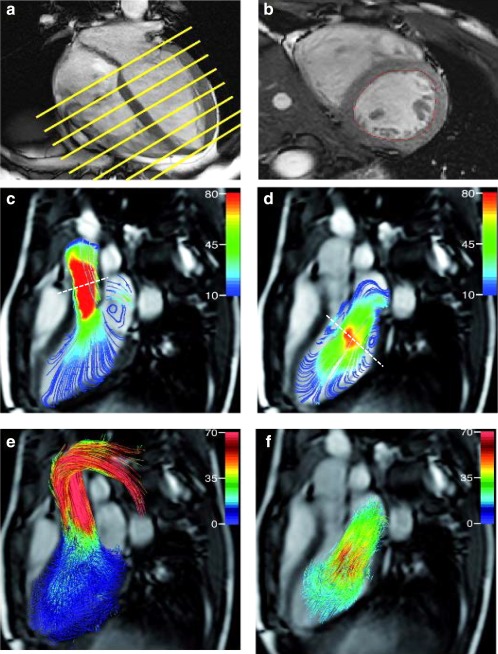
Materials and methods: Ten healthy volunteers (age 27 ± 3 years) underwent multislice cine short-axis planimetry and whole-heart 4D flow MRI on a 3T MRI scanner twice with repositioning between the scans. LV in- and outflow was compared from 1) 2D planimetry; 2) 4D flow MRI with retrospective valve tracking over the mitral valve (MV) and aortic valve (AV), and 3) 4D flow MRI with particle tracing through forward and backward integration of velocity data.
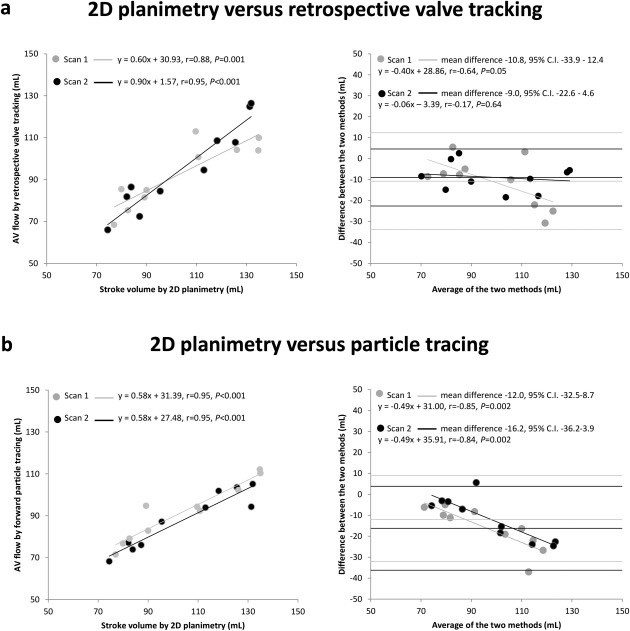
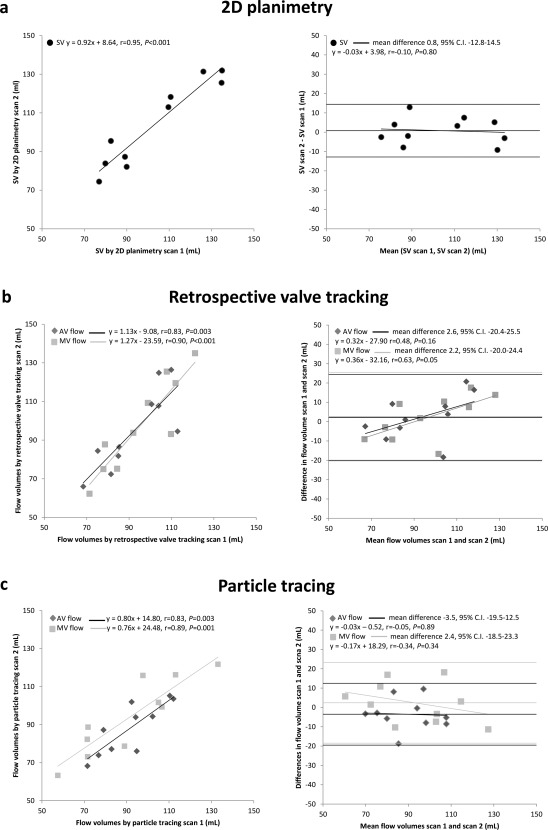
Results: In-scan consistency between MV and AV flow volumes is excellent for both 4D flow MRI methods with r ≥ 0.95 (P ≤ 0.001). In-scan AV and MV flow by retrospective valve tracking shows good to excellent correlations versus AV and MV flow by particle tracing (r ≥ 0.81, P ≤ 0.004). Scan-rescan SV assessment by 2D planimetry shows excellent reproducibility (intraclass correlation [ICC] = 0.98, P < 0.001, coefficient of variation [CV] = 7%). Scan-rescan MV and AV flow volume assessment by retrospective valve tracking shows strong reproducibility (ICCs ≥ 0.89, P ≤ 0.05, CVs = 12%), as well as by forward and backward particle tracing (ICCs ≥ 0.90, P ≤ 0.001, CVs ≤ 11%). Multicomponent particle tracing shows good scan-rescan reproducibility (ICCs ≥ 0.81, P ≤ 0.007, CVs ≤ 16%).
Conclusion: LV in- and outflow assessment by 2D planimetry and 4D flow MRI with retrospective valve tracking and particle tracing show good in-scan consistency and strong scan-rescan reproducibility, which indicates that both 4D flow MRI methods are reliable and can be used clinically.
Level of evidence: 2 Technical Efficacy Stage: 2 J. Magn. Reson. Imaging 2018;47:511-522.
Keywords: 2D planimetry; 4D flow MRI; inflow; outflow; stroke volume.
© 2017 The Authors Journal of Magnetic Resonance Imaging published by Wiley Periodicals, Inc. on behalf of International Society for Magnetic Resonance in Medicine.
Figures
References
-
- Roes SD, Hammer S, van der Geest RJ, et al. Flow assessment through four heart valves simultaneously using 3‐dimensional 3‐directional velocity‐encoded magnetic resonance imaging with retrospective valve tracking in healthy volunteers and patients with valvular regurgitation. Invest Radiol 2009;44:669–675. - PubMed
-
- Westenberg JJ, Roes SD, Ajmone Marsan N, et al. Mitral valve and tricuspid valve blood flow: accurate quantification with 3D velocity‐encoded MR imaging with retrospective valve tracking. Radiology 2008;249:792–800. - PubMed
-
- Calkoen EE, Roest AA, Kroft LJ, et al. Characterization and improved quantification of left ventricular inflow using streamline visualization with 4DFlow MRI in healthy controls and patients after atrioventricular septal defect correction. J Magn Reson Imaging 2015;41:1512–1520. - PubMed
-
- Calkoen EE, Westenberg JJ, Kroft LJ, et al. Characterization and quantification of dynamic eccentric regurgitation of the left atrioventricular valve after atrioventricular septal defect correction with 4D flow cardiovascular magnetic resonance and retrospective valve tracking. J Cardiovasc Magn Resonance 2015;17:18. - PMC - PubMed
Publication types
MeSH terms
LinkOut - more resources
Full Text Sources
Other Literature Sources
Medical
Research Materials
