. 2017 Jun 22;13(6):e1005361.
doi: 10.1371/journal.pcbi.1005361. eCollection 2017 Jun.

Boolean analysis reveals systematic interactions among low-abundance species in the human gut microbiome

Affiliations

Boolean analysis reveals systematic interactions among low-abundance species in the human gut microbiome

Jens Christian Claussen et al. PLoS Comput Biol. .

Abstract

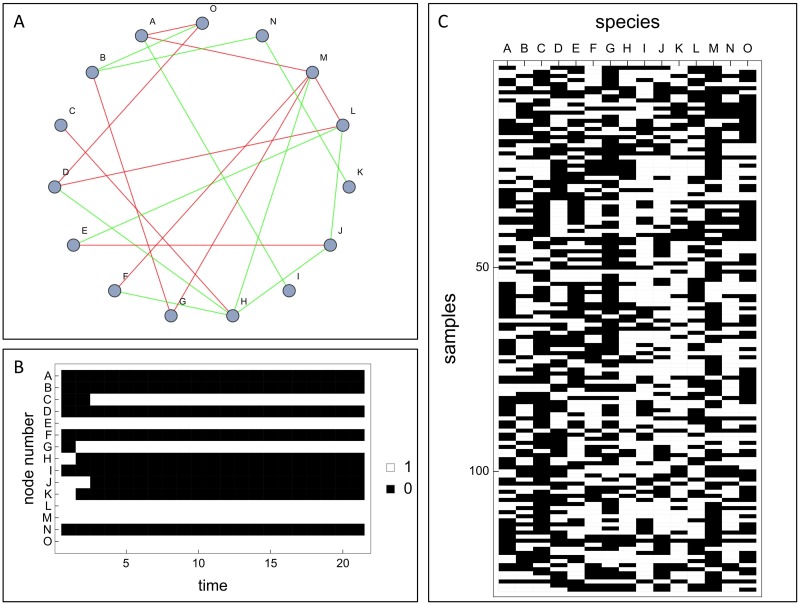
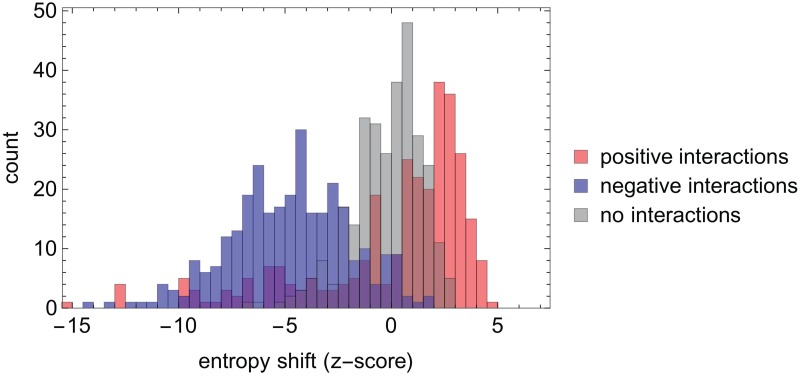
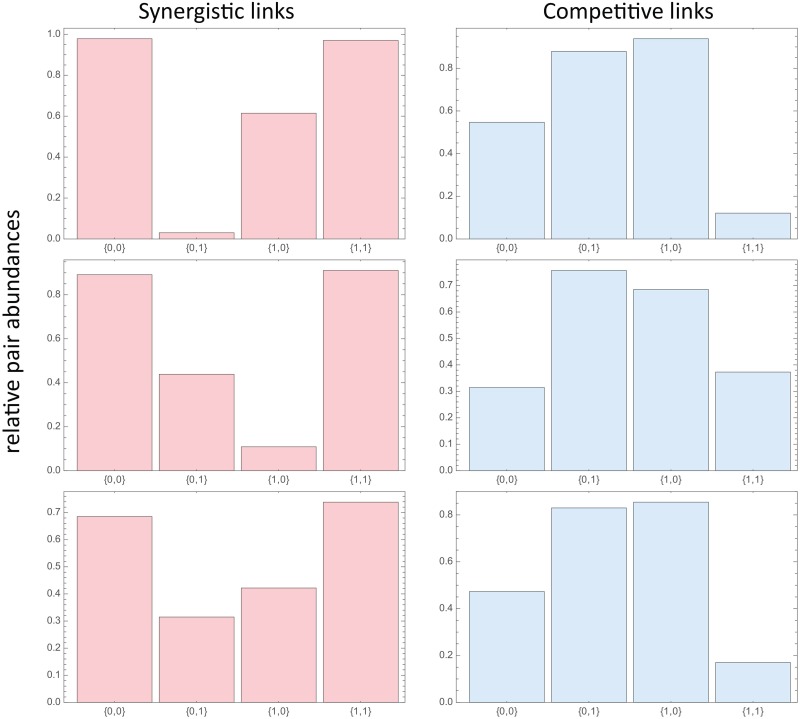
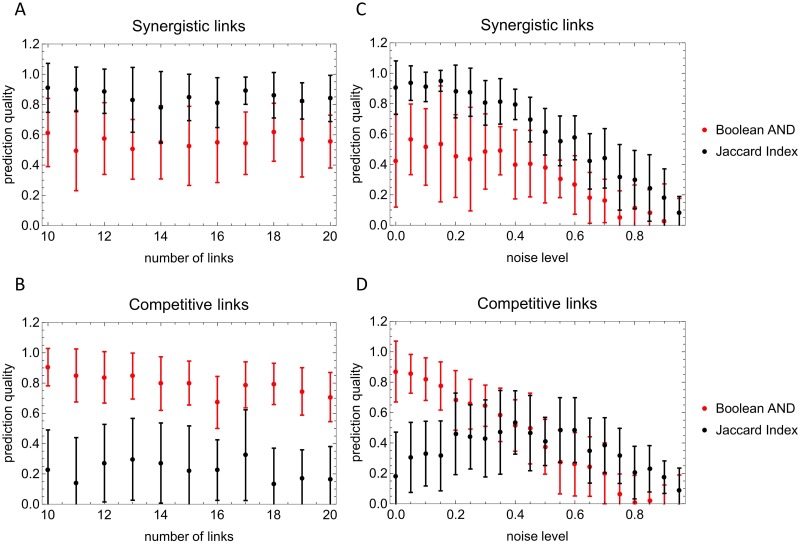
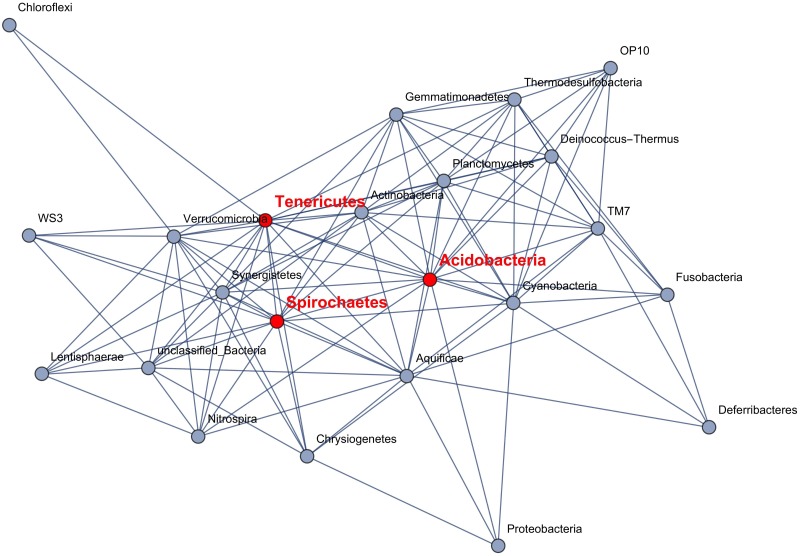
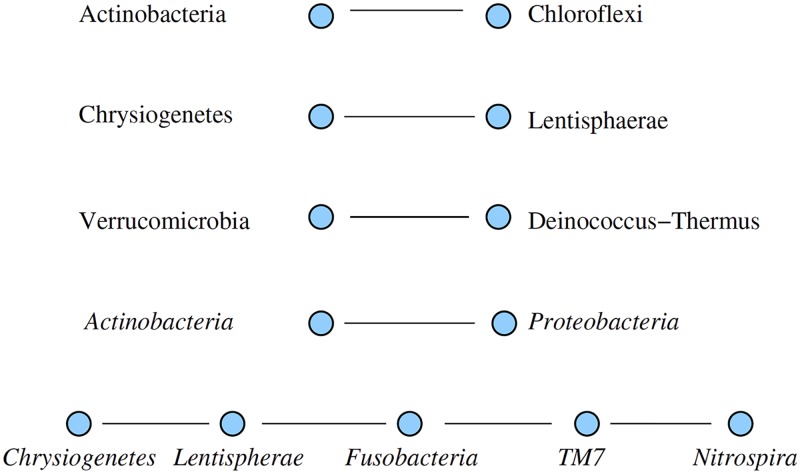
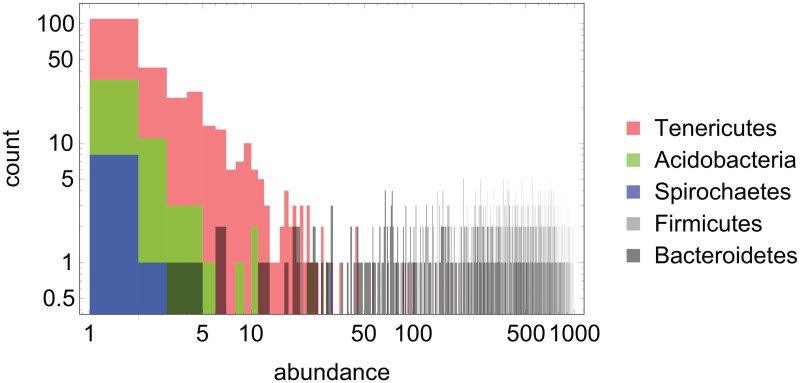
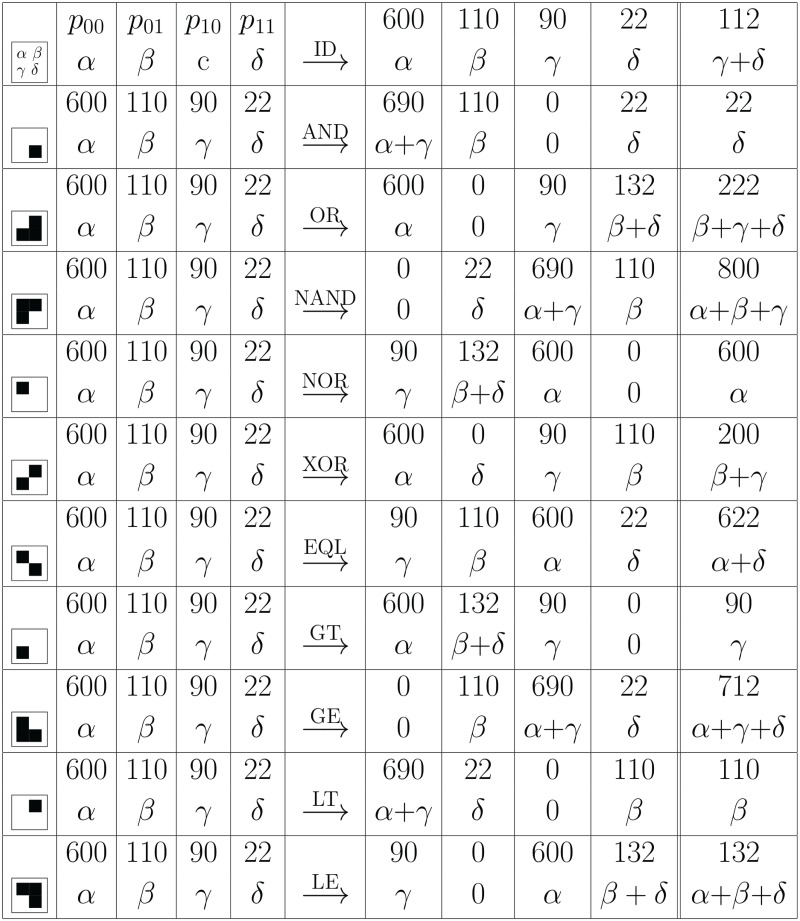
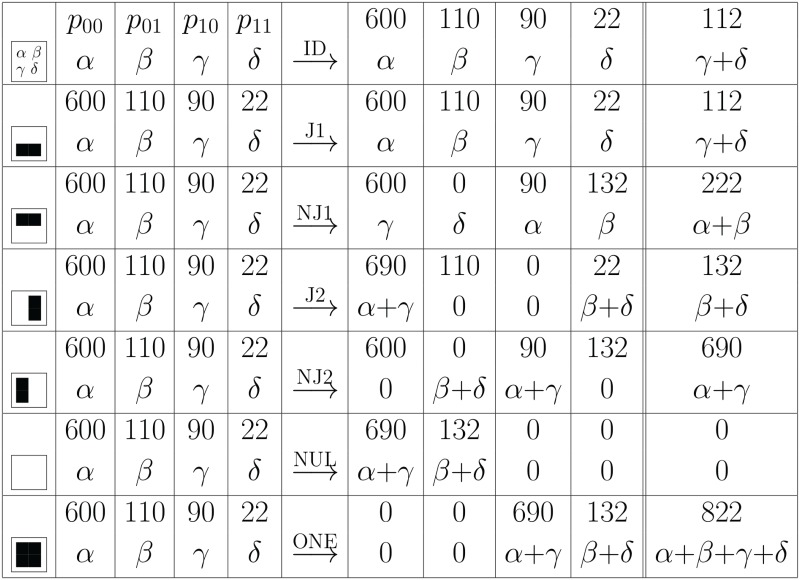
The analysis of microbiome compositions in the human gut has gained increasing interest due to the broader availability of data and functional databases and substantial progress in data analysis methods, but also due to the high relevance of the microbiome in human health and disease. While most analyses infer interactions among highly abundant species, the large number of low-abundance species has received less attention. Here we present a novel analysis method based on Boolean operations applied to microbial co-occurrence patterns. We calibrate our approach with simulated data based on a dynamical Boolean network model from which we interpret the statistics of attractor states as a theoretical proxy for microbiome composition. We show that for given fractions of synergistic and competitive interactions in the model our Boolean abundance analysis can reliably detect these interactions. Analyzing a novel data set of 822 microbiome compositions of the human gut, we find a large number of highly significant synergistic interactions among these low-abundance species, forming a connected network, and a few isolated competitive interactions.


Conflict of interest statement

The authors have declared that no competing interests exist.

Figures

Fig 1
Fig 1
(A) Example of a species interaction network (N = 15, M+ = M = 10) used to generate synthetic data of microbial abundances. The positive (negative) links are displayed in green (red) colour or respectively light gray (dark grey). (B) Time course obtained from recursively updating a random abundance pattern for the species interaction network from (A) according to the update rule, Eq (3). (C) Data matrix Aij showing all (NA = 129) numerically observed attractors for the network from (A).
Fig 2
Fig 2. Histogram of z-scores of entropy shifts obtained with the ESABO method (Boolean AND) applied to simulated binary abundance patterns from 20 species interaction networks consisting of 15 nodes and 15 positive and negative interactions, respectively.
Blue: negative interactions, red: positive interactions, gray: random sample of absent links. (Note that ‘mixed colors’ appear, when histograms overlap.)
Fig 3
Fig 3. Examples of (normalized) pair probabilities pkl(i,j)/min(pk(i),pl(j)) with k, l ∈ {0, 1} for six links of the network from Fig 1A: Three positive interactions (lhs) and three negative interactions (rhs).
Fig 4
Fig 4. Prediction qualities as a function of the number of links M+ = M: (A: Positive interactions) and (B: Negative interactions) and as a function of the noise level in the data: (C: Positive interactions) and (D: Negative interactions).
Parameters used: network size N = 15, averages have been performed over 20 networks, 200 randomizations have been performed for the z-score computation; for the noise level dependence, M+ = M = 10.
Fig 5
Fig 5. Network of mutualistic interactions: Pairs of microbes where the Boolean operation AND leads to a high entropy shift (compared to 1000 randomizations).
Only links with an ESABO score ≥ 1.0 are shown. The edges shown can be interpreted as cooperative mutualistic relationships. Nodes referred to in Fig 7 are highlighted in red.
Fig 6
Fig 6. Network of pairs of microbes (phyla) where the co-occurence is less compared to random pairing.
The ActinobacteriaProteobacteria link is only detected by the entropy shift (ESABO score ≤ − 1), the five-phyla chain is only detected by the co-occurence analysis. The first three links have high z-score values for both methods. As these links are to be interpreted as competition between the species, each subgraph describes a network of mutually suppressing microbes.
Fig 7
Fig 7. Histogram of abundance values (extracted from the 822 microbiome compositions; see Methods) for the two high-abundance phyla, Bacteroidetes and Firmicutes, as well as the three phyla with the highest degree k+ in the network of positive interactions shown in Fig 4, namely Tenericutes (k+ = 16), Acidobacteria (k+ = 16) and Spirochaetes (k+ = 14).
The abscissa displays the count number (of samples) in which a relative abundance (1…1000) is observed for the respective phylum.
Fig 8
Fig 8. Boolean co-abundance patterns and logical operations.
We observe how the abundances of microbe j1 is shifted by the application of a Boolean operation applied to the abundance pair p00(j1, j2) ≕ p00α. Here we use abbreviations αp00, etc., as shown in the first line. Hence, for each set of samples, the values α, β, γ, δ denotes how often each of the four possible configurations occurs. As the result of the Boolean operation replaces ji, the abundance of j1 is given by the sum shown in the last column (= sum of previous two columns). For illustration we have included numerical values of co-abundances among 822 samples where j1 and j2 are measured 112 and 132 times, resp., and one finds co-occurence of j1 and j2 in 22 probes. Here ID denotes the identity operation, AND, OR and XOR (eXclusive-OR) are the common Boolean operations with NAND, NOR and EQL (check if equal) are their logical complements. The operations GT (greater than), GE (greater or equal), LT (less than) and LE (less or equal) are asymmetric comparison operations (see Table Fig 9 for the remaining operations where the output ignores one or two arguments). As one can see, several logical operations lead to visible changes in the j1 abundance.
Fig 9
Fig 9. Boolean co-abundance patterns and logical operations.
The remaining six possible Boolean operations - here shown for completeness - do not provide any further information. Copying the first entry into the first entry (j1) is the identity operation and leads to no change at all. Copying the j2 entry into j1 leads to a change but only copies existing abundance information. Setting the output bit always to one (last row) conveys zero information such that the output is simply number of samples α, β, γ, δ. The other three operations are just logical complements thus likewise convey no additional information.

Similar articles

Cited by

References

    1. Borenstein E. Computational systems biology and in silico modeling of the human microbiome. Briefings in Bioinformatics,. 2012; 13(6):769–780. 10.1093/bib/bbs022 - DOI - PubMed
    1. Brown J, De Vos WM, DiStefano PS, Doré J, Huttenhower C, Knight R, Lawley TD, Raes J, Turnbaugh P. Translating the human microbiome. Nature Biotechnology,. 2013; 31(4):304–308. 10.1038/nbt.2543 - DOI - PubMed
    1. Bucci V, Xavier JB. Towards predictive models of the human gut microbiome. Journal of Molecular Biology. 2014; 426(23):3907–3916. 10.1016/j.jmb.2014.03.017 - DOI - PMC - PubMed
    1. Langille MG, Zaneveld J, Caporaso JG, McDonald D, Knights D, Reyes JA, Clemente JC, Burkepile DE, Thurber RLV, Knight R, et al. Predictive functional profiling of microbial communities using 16s rrna marker gene sequences. Nature Biotechnology. 2013;31(9):814–821. 10.1038/nbt.2676 - DOI - PMC - PubMed
    1. Endesfelder D, zu Castell W, Ardissone A, Davis-Richardson AG, Achenbach P, Hagen M, Pflueger M, Gano KA, Fagen JR, Drew JC, et al. Compromised gut microbiota networks in children with anti-islet cell autoimmunity. Diabetes. 2014; 63, 2006–2014. 10.2337/db13-1676 - DOI - PubMed

MeSH terms

LinkOut - more resources