. 2017 Jun 22;12(6):e0179460.
doi: 10.1371/journal.pone.0179460. eCollection 2017.

An R-CaMP1.07 reporter mouse for cell-type-specific expression of a sensitive red fluorescent calcium indicator

Affiliations

An R-CaMP1.07 reporter mouse for cell-type-specific expression of a sensitive red fluorescent calcium indicator

Philipp Bethge et al. PLoS One. .

Abstract

Genetically encoded calcium indicators (GECIs) enable imaging of in vivo brain cell activity with high sensitivity and specificity. In contrast to viral infection or in utero electroporation, indicator expression in transgenic reporter lines is induced noninvasively, reliably, and homogenously. Recently, Cre/tTA-dependent reporter mice were introduced, which provide high-level expression of green fluorescent GECIs in a cell-type-specific and inducible manner when crossed with Cre and tTA driver mice. Here, we generated and characterized the first red-shifted GECI reporter line of this type using R-CaMP1.07, a red fluorescent indicator that is efficiently two-photon excited above 1000 nm. By crossing the new R-CaMP1.07 reporter line to Cre lines driving layer-specific expression in neocortex we demonstrate its high fidelity for reporting action potential firing in vivo, long-term stability over months, and versatile use for functional imaging of excitatory neurons across all cortical layers, especially in the previously difficult to access layers 4 and 6.


Conflict of interest statement

Competing Interests: The authors have declared that no competing interests exist.

Figures

Fig 1
Fig 1. AAV-mediated viral expression of R-CaMP1.07 in vivo.
A, Confocal image of a fixed brain slice illustrating R-CaMP1.07 expression across cortical layers of S1 barrel cortex after virus injections. B, Left: In vivo two-photon images of neurons expressing R-CaMP1.07 at different imaging depths down to L6. Right: Example spontaneous calcium transients in three example neurons (marked) per imaging field. C, Simultaneous fluorescence measurement and juxtacellular AP recording from an R-CaMP1.07-expressing L2/3 pyramidal neuron. Inset shows pipette attached to the cell. The ΔF/F trace shows calcium transients with variable amplitude, even resolving single-AP evoked transients. The number of spikes per burst is indicated below the voltage trace. D, Average ΔF/F calcium transient for R-CaMP1.07 in response to a single AP in red and (± S.E.M in grey; n = 49). E, Peak amplitudes of ΔF/F calcium transients as a function of the number of APs within short AP bursts (300-ms time window; mean ± S.E.M.).
Fig 2
Fig 2. Characterization of layer-specific R-CaMP1.07 expression in triple transgenic mice.
A, Schematic diagram of intersectional control by Cre and tTA, driven by different promoters, of the doubly regulated TITL-R-CaMP1.07 reporter line. tTA is driven by a CamK2a promoter, whereas layer-specificity is achieved by Cre expressed under the control of layer-specific promoters (p2: Rasgrf2-2A for L2/3, Nr5a1 for L4, Rbp4 for L5 and Ntsr1 for L6). B, Confocal images of coronal sections of fixed brains from the different mice, illustrating layer-specific labelling in neocortex of the respective mouse lines. C, High-resolution close-ups of the regions indicated in B, showing the R-CaMP1.07 expression patterns across cortical layers.
Fig 3
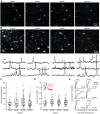
Fig 3. Layer-specific R-CaMP1.07 expression and calcium transients in vivo.
A, Large field-of-view two-photon images in S1 cortex for the four different mouse lines expressing R-CaMP1.07. In L4-R-CaMP1.07 mice the barrels and septa in S1 cortex are clearly discernible. B, Example spontaneous R-CaMP1.07 calcium transients measured in awake mice of the corresponding mouse lines. Traces for three example cells (marked) are shown for each imaging field.
Fig 4
Fig 4. R-CaMP1.07 sensitivity for reporting APs in vivo.
A, Left: Cell body of an R-CaMP1.07-expressing L2/3 neuron and recording pipette. Right: Simultaneous fluorescence measurement and juxtacellular AP recording from this neuron. The number of spikes per burst is indicated below the voltage trace. B, Average ΔF/F calcium transient for R-CaMP1.07 in response to a single AP in red (± S.E.M as grey traces; n = 63 transients from 8 cells, 3 mice). C, Peak amplitudes of ΔF/F calcium transients (red data points) as a function of the number of APs within short AP bursts (300-ms time window; mean ± S.E.M.). For comparison R-CaMP1.07 performance for AAV-mediated expression (same as Fig 1E) is overlaid (grey data points). D, Efficiency of AP detection in vivo was determined by estimating the distribution of the signal-to-noise ratio (SNR) under noise conditions and fitting with a Gaussian. From the fit, we determined the SNR cutoff at which less than 5% of baseline traces would be classified as false positives (SNR = 2.28). Using this threshold, 60% (38/63) of single APs, 97% of doublets (38/39) and 100% of triplets (30/30) were correctly detected (see ref. [53]).
Fig 5
Fig 5. Long-term stability of L2/3 R-CaMP1.07 calcium signals.
A, Longitudinal two-photon imaging of the same group of cells in L2/3 of S1 cortex in an example mouse, at 22, 45, 65 and 100 days post-induction (DPI). For a spectrally unmixed version of the image at 65 DPI see S3 Fig. B, Two-photon images of L2/3 neurons within the same tissue volume, for which R-CaMP1.07 calcium transients were measured across days. In the imaging sessions 65 DPI and 100 DPI the very same neurons were measured (same cells as in A). For each imaging area three example ΔF/F traces with spontaneous calcium transients are shown for the cells marked in the images above. C, Pooled analysis of stability of R-CaMP1.07 calcium transients. Recordings were made in 2 mice from a total of 18, 15, 15, and 38 active cells at 22, 45, 65, and 100 DPI, respectively. Data points and box plots of peak amplitudes of calcium transient events did not show significant variation across sessions. D, Data points and box plots of decay time constants (τ) of exponentially fitted calcium transients (see inset), which also did not show a significant change across imaging sessions. E, Cumulative distribution of calcium transient amplitudes for L2/3 neurons that were measured twice at 65 and 100 DPI, respectively. A non-parametric, Wilcoxon rank sum test was used to compute P-values.

References

    1. Grienberger C, Konnerth A. Imaging calcium in neurons. Neuron. 2012;73(5):862–85. doi: 10.1016/j.neuron.2012.02.011 . - DOI - PubMed
    1. Lin MZ, Schnitzer MJ. Genetically encoded indicators of neuronal activity. Nature Neuroscience. 2016;19(9):1142–53. doi: 10.1038/nn.4359 . - DOI - PMC - PubMed
    1. Tian L, Hires SA, Mao T, Huber D, Chiappe ME, Chalasani SH, et al. Imaging neural activity in worms, flies and mice with improved GCaMP calcium indicators. Nature Methods. 2009;6(12):875–81. doi: 10.1038/nmeth.1398 - DOI - PMC - PubMed
    1. Chen TW, Wardill TJ, Sun Y, Pulver SR, Renninger SL, Baohan A, et al. Ultrasensitive fluorescent proteins for imaging neuronal activity. Nature. 2013;499(7458):295–300. doi: 10.1038/nature12354 ; - DOI - PMC - PubMed
    1. Nakai J, Ohkura M, Imoto K. A high signal-to-noise Ca2+ probe composed of a single green fluorescent protein. Nature Biotechnology. 2001;19(2):137–41. doi: 10.1038/84397 - DOI - PubMed