. 2017 Jun 22;13(6):e1006771.
doi: 10.1371/journal.pgen.1006771. eCollection 2017 Jun.

Ribosomal DNA copy number loss and sequence variation in cancer

Affiliations

Ribosomal DNA copy number loss and sequence variation in cancer

Baoshan Xu et al. PLoS Genet. .

Abstract

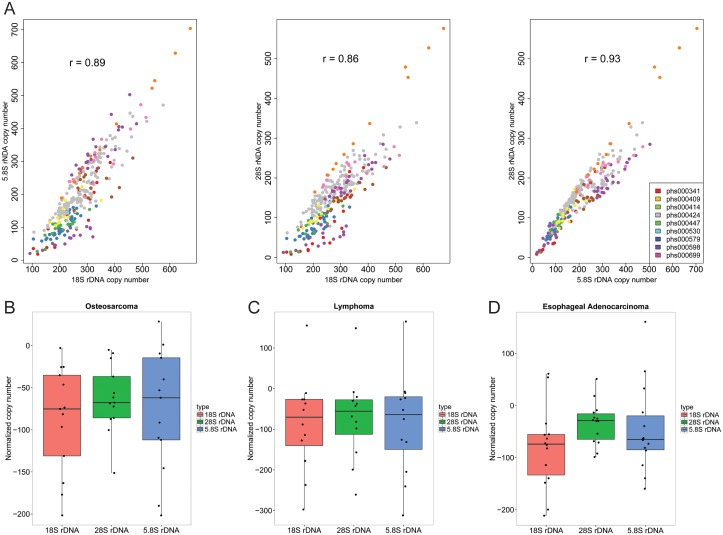
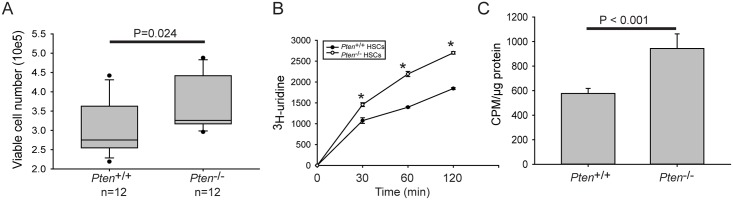
Ribosomal DNA is one of the most variable regions in the human genome with respect to copy number. Despite the importance of rDNA for cellular function, we know virtually nothing about what governs its copy number, stability, and sequence in the mammalian genome due to challenges associated with mapping and analysis. We applied computational and droplet digital PCR approaches to measure rDNA copy number in normal and cancer states in human and mouse genomes. We find that copy number and sequence can change in cancer genomes. Counterintuitively, human cancer genomes show a loss of copies, accompanied by global copy number co-variation. The sequence can also be more variable in the cancer genome. Cancer genomes with lower copies have mutational evidence of mTOR hyperactivity. The PTEN phosphatase is a tumor suppressor that is critical for genome stability and a negative regulator of the mTOR kinase pathway. Surprisingly, but consistent with the human cancer genomes, hematopoietic cancer stem cells from a Pten-/- mouse model for leukemia have lower rDNA copy number than normal tissue, despite increased proliferation, rRNA production, and protein synthesis. Loss of copies occurs early and is associated with hypersensitivity to DNA damage. Therefore, copy loss is a recurrent feature in cancers associated with mTOR activation. Ribosomal DNA copy number may be a simple and useful indicator of whether a cancer will be sensitive to DNA damaging treatments.


Conflict of interest statement

The authors have declared that no competing interests exist.

Figures

Fig 1
Fig 1. The profiles of rDNA copy number in various tissues from three mouse strains.
(A). The pattern of rDNA copy number from 15 different tissues from C57BL/6 mice, (B). The pattern of rDNA copy number from 15 different tissues from CD1 mice, (C). The pattern of rDNA copy number from 15 different tissues from DBA/2J mice.
Fig 2
Fig 2. Three cancer genome projects display a lower copy number of 18S, 28S, and 5.8S coding-regions in the 45S rDNA repeats.
(A). The pairwise correlations between 18S, 28S, and 5.8S coding sequences are shown for the calculated copy number for all normal samples from the eight cancer projects and GTEx data sets. Both the correlations and the range in copy number is similar to previously published values [17]. (B-D). Normalized copy number for 18S, 28S, and 5.8S rDNA regions is shown for cancer genomes from osteosarcoma, AIDS-related lymphoma, and esophageal adenocarcinoma. (B) 18S_rDNA, P-value = 0.000335; 5.8S_rDNA, P-value = 0.002485; 28S_rDNA, P-value = 0.0001197. (C) 18S_rDNA, P-value = 0.02726; 5.8S_rDNA, P-value = 0.03649; 28S_rDNA, P-value = 0.03703. (D) 18S_rDNA, P-value = 0.00214; 5.8S_rDNA, P-value = 0.0647; 28S_rDNA, P-value = 0.008664.
Fig 3
Fig 3. The three low-copy number cancer genome projects have concerted copy number changes in additional genes.
(A). The heatmap depicts a cluster of genes with a copy number increase in the three genome projects that have a decrease in rDNA copies. (B). The GO term analysis indicated enrichment for biological processes (BP) such as metabolic process and DNA damage response, molecular functions (MF) such as transcription, and cellular compartments (CC). All terms have a p value less than 0.01 using a hypergeometric test.
Fig 4
Fig 4. SNV analysis of rDNA loci in the eight cancer genomes from tumor/normal pairs.
The match between the test genome and the reference genome sequence was scored at each bp for all genomes. SNVs common to matched pairs were considered “shared” and not included in the analysis in A-C. (A). The plot depicts unique SNVs per kb in the repeat in normal and cancer genomes, with the project number indicated on the x axis, and the allele number on each bar. (B). All unique SNVs for all projects were summed together to depict the SNVs per kb for the different regions of the repeat. The total number of SNVs in each region is annotated on each bar. (C). The number of unique SNVs identified in the 28S region are plotted by position relative to the 45S repeat in GenBank. Hotspots of variation are apparent. (D). The number of alleles for each shared SNVs in each genome pair was used to calculate an average allele number per genome. The average for the normal genome was subtracted from the average calculated for the matched tumor genome to yield the allele difference, plotted by project with results of a t test indicated for each (phs000341, 0.0467, phs000409, 0.7223, phs000414, 0.3458, phs000447, 0.0011, phs000530, 0.8773, phs000579, 0.9782, phs000598, 0.0144, phs000699, 0.0641).
Fig 5
Fig 5. Pten-/- HSCs show rDNA copy number reduction and sensitivity to DNA damage.
(A). Pten-/- null HSCs exhibited a decrease in rDNA copy number compared to matched WT HSCs, samples were derived from two female mice of each genotype with 20 clones each. (B). The rDNA copy number in the mouse tail gDNA samples was similar between individuals, and was also similar to rDNA copy number in WT HSCs. (C-F). HSCs were treated as indicated with bleomycin, ionizing radiation (IR), methyl methanesulfonate (MMS), or hydroxyurea (HU) and the viability was calculated at day five based on total cell number and trypan blue staining. Each dosage was performed in triplicate and the error bars represent standard deviation. Data shown was derived from HSCs from two mice of each genotype. Asterisks represent values for which a t test indicates statistical significance below 0.05.
Fig 6
Fig 6. Proliferation, rRNA production, and protein synthesis are robust in Pten-/- HSCs.
(A). To measure proliferation, HSCs were plated in 100 μl fresh medium, and cultured for 5 days. The viable cell number was measured based on total cell number and trypan blue staining. Data shown was derived from 12 clones derived from two age matched female mice of each genotype. (B). HSCs were pulse labeled with 3H-uridine for the time indicated. RNA was isolated with TriZol reagent. 1 μg of total RNA was counted in a Beckman LS 6500 multipurpose scintillation counter to determine new rRNA production. Three clones were labeled to derive the standard deviation from two pairs of mice of each genotype from the same litter. Significance was calculated using an unpaired t test, the asterisk indicates p<0.05. (C). To measure global protein synthesis, HSCs were pre-cultured in medium lacking methionine, and pre-treated with 10 μM MG-132, a proteasome inhibitor, for 1 hour. HSCs were incubated with 30 μCi of 35S-methionine for 1 hour. Incorporation of 35S-methionine into proteins was quantified in a liquid scintillation counter. Clones were derived from two mice of each genotype, with three replicates per genotype. A t test was performed for statistical significance.
Fig 7
Fig 7. Pten-/- HSCs are sensitive to DNA damage when mTOR activity is blocked with INK128.
A. Western blot confirming that INK128 treatment (300 nM) blocks mTOR activity in HSCs after 5 days. All HSCs are derived from three age matched males of each genotype. B. Pten-/- HSCs exhibited a decrease in rDNA copy number compared to matched WT HSCs, samples were derived from three males of each genotype with 10 clones total, 3 from 2 mice and 4 from the third. (C). The rDNA copy number in the mouse tail gDNA samples was similar between individuals, and was also similar to rDNA copy number in WT HSCs. (D) for D-F, Six independent HSC clones were used per condition, two from each mouse. 3H-uridine incorporation was measured after 2 hours of labelling as described in Fig 6B. E. Protein synthesis was measured as described in Fig 6C. F. HSCs were pretreated with INK128 for 2 hrs prior to the addition of bleomycin. INK128 or DMSO and bleomycin were maintained in the culture for the duration of the experiment. Viability was calculated at day five based on total cell number and trypan blue staining.

References

    1. McStay B (2016) Nucleolar organizer regions: genomic 'dark matter' requiring illumination. Genes Dev 30: 1598–1610. doi: 10.1101/gad.283838.116 - DOI - PMC - PubMed
    1. Forsburg SL (2013) The CINs of the centromere. Biochem Soc Trans 41: 1706–1711. doi: 10.1042/BST20130146 - DOI - PMC - PubMed
    1. De Lange T (2005) Telomere-related genome instability in cancer. Cold Spring Harb Symp Quant Biol 70: 197–204. doi: 10.1101/sqb.2005.70.032 - DOI - PubMed
    1. Gibbons JG, Branco AT, Godinho SA, Yu S, Lemos B (2015) Concerted copy number variation balances ribosomal DNA dosage in human and mouse genomes. Proc Natl Acad Sci U S A 112: 2485–2490. doi: 10.1073/pnas.1416878112 - DOI - PMC - PubMed
    1. Long EO, Dawid IB (1980) Repeated genes in eukaryotes. Annu Rev Biochem 49: 727–764. doi: 10.1146/annurev.bi.49.070180.003455 - DOI - PubMed