. 2017 Jun 22;12(6):e0179856.
doi: 10.1371/journal.pone.0179856. eCollection 2017.

Glucose dysregulation and response to common anti-diabetic agents in the FATZO/Pco mouse

Affiliations

Glucose dysregulation and response to common anti-diabetic agents in the FATZO/Pco mouse

Richard G Peterson et al. PLoS One. .

Abstract

The FATZO/Pco mouse is the result of a cross of the C57BL/6J and AKR/J strains. The crossing of these two strains and the selective inbreeding for obesity, insulin resistance and hyperglycemia has resulted in an inbred strain exhibiting obesity in the presumed presence of an intact leptin pathway. Routinely used rodent models for obesity and diabetes research have a monogenic defect in leptin signaling that initiates obesity. Given that obesity and its sequelae in humans are polygenic in nature and not associated with leptin signaling defects, the FATZO mouse may represent a more translatable rodent model for study of obesity and its associated metabolic disturbances. The FATZO mouse develops obesity spontaneously when fed a normal chow diet. Glucose intolerance with increased insulin levels are apparent in FATZO mice as young as 6 weeks of age. These progress to hyperglycemia/pre-diabetes and frank diabetes with decreasing insulin levels as they age. The disease in these mice is multi-faceted, similar to the metabolic syndrome apparent in obese individuals, and thus provides a long pre-diabetic state for determining the preventive value of new interventions. We have assessed the utility of this new model for the pre-clinical screening of agents to stop or slow progression of the metabolic syndrome to severe diabetes. Our assessment included: 1) characterization of the spontaneous development of disease, 2) comparison of metabolic disturbances of FATZO mice to control mice and 3) validation of the model with regard to the effectiveness of current and emerging anti-diabetic agents; rosiglitazone, metformin and semaglutide.

Conclusion: Male FATZO mice spontaneously develop significant metabolic disease when compared to normal controls while maintaining hyperglycemia in the presence of high leptin levels and hyperinsulinemia. The disease condition responds to commonly used antidiabetic agents.


Conflict of interest statement

Competing Interests: The authors have read the journal’s policy and have the following conflicts: JAF, MDM, PJE and TC are paid employees of Eli Lilly and Company and may own company stock or possess stock options; CVJ is a paid employee of Crown Bioscience – Indiana and may own company stock or possess stock options; KMZ and RGP are paid consultants of Crown Bioscience – Indiana and were investigators on the SBIR grant that partially funded the development of the FATZO mouse. This does not alter the authors’ adherence to PLOS ONE policies on sharing data and materials.

Figures

Fig 1
Fig 1. Post-prandial glucose (A) and insulin (B) concentrations in untreated male FATZO mice (6–22 weeks of age).
Hyperglycemia developed spontaneously and was evident in animals as young as 6 weeks of age (A). Insulin responses to developing hyperglycemia create hyperinsulinemia during a period of marked insulin resistance (B). Each value represents the Mean ± SEM, n = 72. Analysis demonstrated increased glucose concentrations from baseline from 12–22 weeks of age and increases from baseline insulin concentrations from 8–22 weeks, (one-way repeated measures ANOVA, * p < .05 compared to baseline).
Fig 2
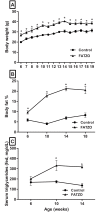
Fig 2. Body weight, body fat and serum triglycerides in untreated male FATZO mice compared to control mice.
FATZO mice (▲) were significantly heavier (A) compared to age-matched C57BL/6J control mice (●) at each age (Mean ± SD). Increased levels of body fat contributes to increased body weight in FATZO mice (B). Body fat in FATZO mice (▲) was significantly higher when compared to control mice (●) from 6–18 weeks of age. Post-prandial serum triglycerides increased in untreated male FATZO mice (▲) as they aged and were significantly elevated when compared to control (●) mice at 10 and 14 weeks of age (n = 6, two-way repeated measures (A, B) or two-way ordinary ANOVA (C), * p < .05 when compared to control).
Fig 3
Fig 3. Glucose responses to a glucose load during performance of oral glucose tolerance test (OGTT) in control (A), FATZO mice (B) and the areas under the curve for both groups (C).
An age-dependent impairment in glucose handling was apparent in FATZO mice compared to control mice in mice as young as 6 weeks. Glucose AUC (C) increased with age in FATZO mice (▲) compared to control mice (●) (two-way repeated measures, ANOVA * p < .05 when compared to control).
Fig 4
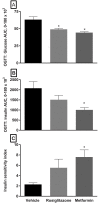
Fig 4. Area under the curve (AUC) analysis of glucose (A) and insulin (B) responses during OGTT and calculated insulin sensitivity index (C)(ISI) in FATZO mice following an 8-week administration of rosiglitazone or metformin.
Both insulin sensitizers elicited significant reductions in the AUC for glucose in FATZO mice (A). Although it is reduced, insulin AUC did not reach significance for the rosiglitazone group but it did for the metformin group (B). Significant improvement in ISI was also demonstrated with metformin treatment and, although improved, rosiglitazone treatment did not reach statistical significance when compared to vehicle (one-way ANOVA, * p < .05 when compared to vehicle).
Fig 5
Fig 5. Body weight food intake in male FATZO mice during administration of semaglutide (1–10 nmol/kg, SQ, q3d, x 16 days).
Semaglutide elicited dose-dependent decreases in body weight compared to vehicle within 2 days of start of treatment (A). At study end, animals administered semaglutide lost significantly more body weight compared to baseline values than vehicle treated animals (B). Daily variation in feed intake was apparent in all groups (C). A transient, dose-dependent reduction in feed intake compared to pre-dose values was observed during the 24 hrs following each semaglutide administration (D). Of note, a boiler failure resulted in decreased humidity of about 25% for one day which correlated with a transient increase in feed intake between day 2 and 3 [Vehicle ●, 1 nmol/kg ■, 3 nmol/kg ▲, and 10 nmol/kg ▼] (one-way ANOVA, * p < .05 when compared to vehicle).
Fig 6
Fig 6. Changes in blood glucose and glucose responses to a glucose load during performance of oral glucose tolerance test in male FATZO mice following administration of semaglutide.
Post-prandial glucose measured 24 hours after administration of semaglutide was dose-dependently reduced compared to vehicle over the course of the study (A) (two-way ANOVA, * p < .05 when compared to baseline). Terminal glucose data were also plotted as % decrease in glucose concentrations compared to baseline. The responses of all of the semaglutide groups were significantly higher than that of vehicle treated animals (B). Improvements in glucose handling were dose-dependent and significant compared to vehicle when administered at 10 nmol/kg (C, D) [Vehicle ●, 1 nmol/kg ■, 3 nmol/kg ▲, and 10 nmol/kg ▼] (one-way ANOVA, * p < .05 when compared to vehicle).

References

    1. Reaven GM (1988) Banting lecture 1988. Role of insulin resistance in human disease. Diabetes 37: 1595–1607. - PubMed
    1. Reaven GM (2003) The insulin resistance syndrome. Curr Atheroscler Rep 5: 364–371. - PubMed
    1. Reaven GM (2009) Is diagnosing metabolic syndrome a uniquely simple way to predict incident type 2 diabetes mellitus? CMAJ 180: 601–602. doi: 10.1503/cmaj.090092 - DOI - PMC - PubMed
    1. Ervin RB (2009) Prevalence of metabolic syndrome among adults 20 years of age and over, by sex, age, race and ethnicity, and body mass index: United States, 2003–2006. Natl Health Stat Report 1–7. - PubMed
    1. Wildman RP, Muntner P, Reynolds K, McGinn AP, Rajpathak S, Wylie-Rosett J, et al. (2008) The obese without cardiometabolic risk factor clustering and the normal weight with cardiometabolic risk factor clustering: prevalence and correlates of 2 phenotypes among the US population (NHANES 1999–2004). Arch Intern Med 168: 1617–1624. doi: 10.1001/archinte.168.15.1617 - DOI - PubMed