

Correlation of disease severity with body weight and high fat diet in the FATZO/Pco mouse
- PMID: 28640904
- PMCID: PMC5480996
- DOI: 10.1371/journal.pone.0179808
Correlation of disease severity with body weight and high fat diet in the FATZO/Pco mouse
Abstract
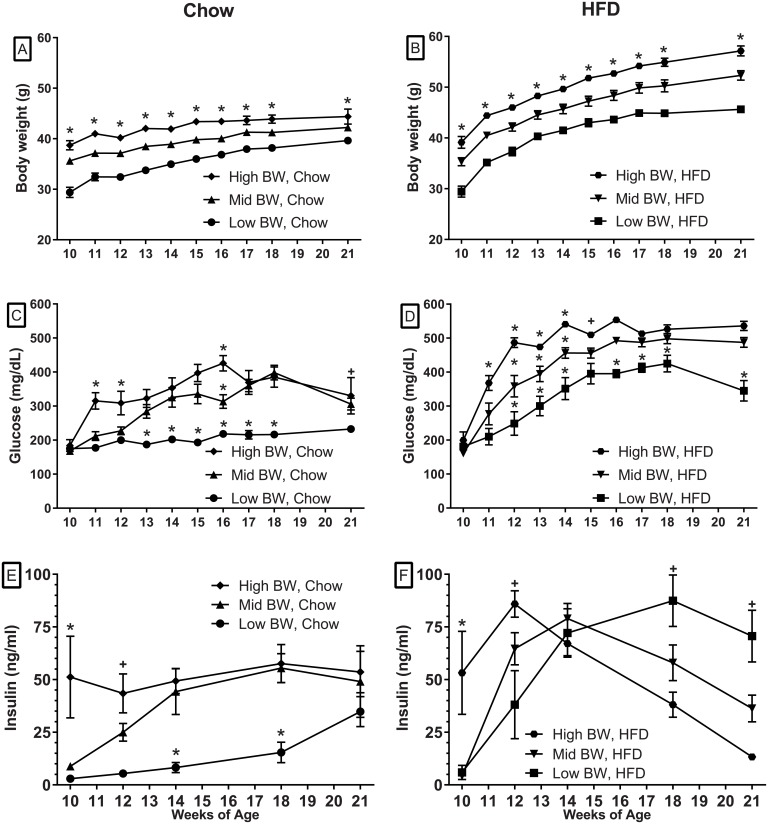
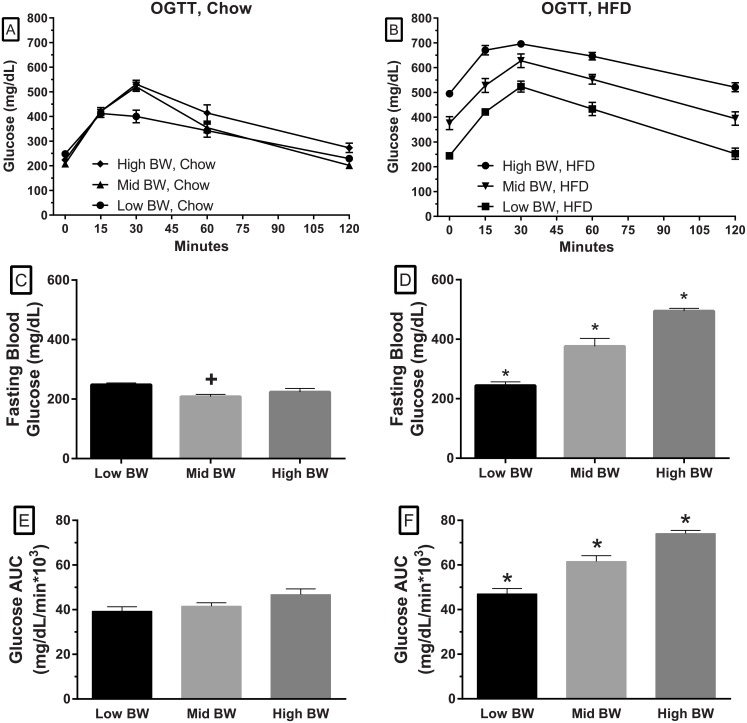
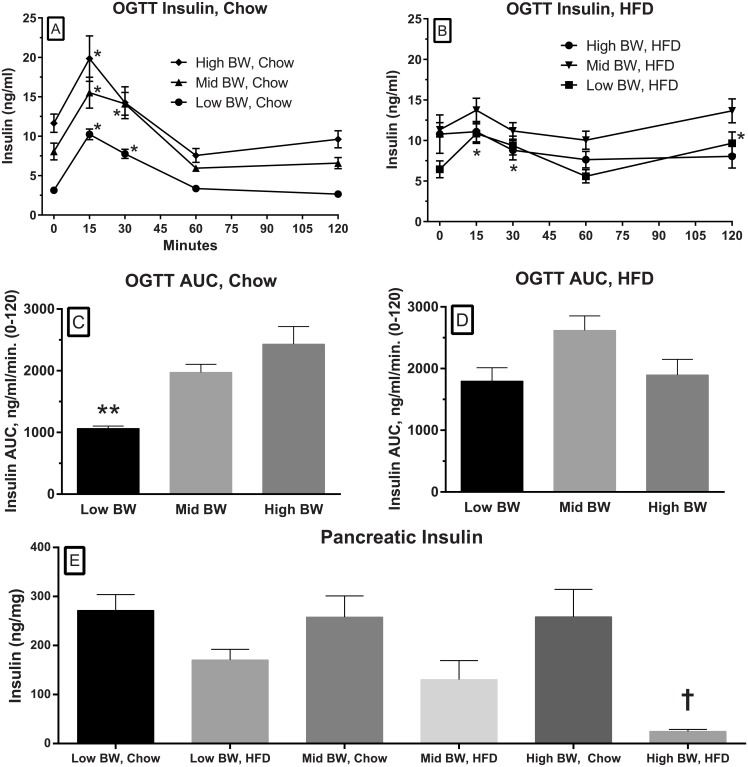
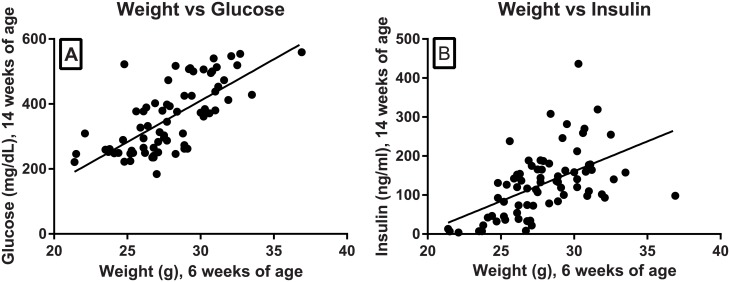
Obesity in many current pre-clinical animal models of obesity and diabetes is mediated by monogenic mutations; these are rarely associated with the development of human obesity. A new mouse model, the FATZO mouse, has been developed to provide polygenic obesity and a metabolic pattern of hyperglycemia and hyperinsulinemia, that support the presence of insulin resistance similar to metabolic disease in patients with insulin resistance/type 2 diabetes. The FATZO mouse resulted from a cross of C57BL/6J and AKR/J mice followed by selective inbreeding for obesity, increased insulin and hyperglycemia. Since many clinical studies have established a close link between higher body weight and the development of type 2 diabetes, we investigated whether time to progression to type 2 diabetes or disease severity in FATZO mice was dependent on weight gain in young animals. Our results indicate that lighter animals developed metabolic disturbances much slower and to a lesser magnitude than their heavier counterparts. Consumption of a diet containing high fat, accelerated weight gain in parallel with disease progression. A naturally occurring and significant variation in the body weight of FATZO offspring enables these mice to be identified as low, mid and high body weight groups at a young age. These weight groups remain into adulthood and correspond to slow, medium and accelerated development of type 2 diabetes. Thus, body weight inclusion criteria can optimize the FATZO model for studies of prevention, stabilization or treatment of type 2 diabetes.
Conflict of interest statement
Figures
Similar articles
-
Glucose dysregulation and response to common anti-diabetic agents in the FATZO/Pco mouse.PLoS One. 2017 Jun 22;12(6):e0179856. doi: 10.1371/journal.pone.0179856. eCollection 2017. PLoS One. 2017. PMID: 28640857 Free PMC article.
-
The FATZO mouse, a next generation model of type 2 diabetes, develops NAFLD and NASH when fed a Western diet supplemented with fructose.BMC Gastroenterol. 2019 Mar 18;19(1):41. doi: 10.1186/s12876-019-0958-4. BMC Gastroenterol. 2019. PMID: 30885145 Free PMC article.
-
The Oikawa-Nagao Mouse: A Polygenic Animal Model for Unraveling the Pathophysiology of Type 2 Diabetes and Obesity.J Nippon Med Sch. 2025;92(1):2-9. doi: 10.1272/jnms.JNMS.2025_92-104. J Nippon Med Sch. 2025. PMID: 40058831 Review.
-
Voluntary wheel-running attenuates insulin and weight gain and affects anxiety-like behaviors in C57BL6/J mice exposed to a high-fat diet.Behav Brain Res. 2016 Sep 1;310:1-10. doi: 10.1016/j.bbr.2016.04.051. Epub 2016 May 3. Behav Brain Res. 2016. PMID: 27154535
-
Etiology of the metabolic syndrome: potential role of insulin resistance, leptin resistance, and other players.Ann N Y Acad Sci. 1999 Nov 18;892:25-44. doi: 10.1111/j.1749-6632.1999.tb07783.x. Ann N Y Acad Sci. 1999. PMID: 10842650 Review.
Cited by
-
In Vitro and In Vivo Models of Non-Alcoholic Fatty Liver Disease: A Critical Appraisal.J Clin Med. 2020 Dec 24;10(1):36. doi: 10.3390/jcm10010036. J Clin Med. 2020. PMID: 33374435 Free PMC article. Review.
-
Mouse models of nonalcoholic steatohepatitis and their application to new drug development.Arch Pharm Res. 2022 Nov;45(11):761-794. doi: 10.1007/s12272-022-01410-5. Epub 2022 Nov 1. Arch Pharm Res. 2022. PMID: 36318445 Review.
-
Carbon tetrachloride (CCl4) accelerated development of non-alcoholic fatty liver disease (NAFLD)/steatohepatitis (NASH) in MS-NASH mice fed western diet supplemented with fructose (WDF).BMC Gastroenterol. 2020 Oct 15;20(1):339. doi: 10.1186/s12876-020-01467-w. BMC Gastroenterol. 2020. PMID: 33059584 Free PMC article.
-
Metabolic Syndrome Nonalcoholic Steatohepatitis Male Mouse With Adeno-Associated Viral Renin as a Novel Model for Heart Failure With Preserved Ejection Fraction.J Am Heart Assoc. 2024 Dec 3;13(23):e035894. doi: 10.1161/JAHA.124.035894. Epub 2024 Nov 22. J Am Heart Assoc. 2024. PMID: 39575718 Free PMC article.
-
Nonalcoholic steatohepatitis severity is defined by a failure in compensatory antioxidant capacity in the setting of mitochondrial dysfunction.World J Gastroenterol. 2018 Apr 28;24(16):1748-1765. doi: 10.3748/wjg.v24.i16.1748. World J Gastroenterol. 2018. PMID: 29713129 Free PMC article.
References
-
- Weker H (2006) [Simple obesity in children. A study on the role of nutritional factors]. Med Wieku Rozwoj 10: 3–191. - PubMed
-
- Ng M, Fleming T, Robinson M, Thomson B, Graetz N, Margono C, et al. (2014) Global, regional, and national prevalence of overweight and obesity in children and adults during 1980–2013: a systematic analysis for the Global Burden of Disease Study 2013. Lancet 384: 766–781. doi: 10.1016/S0140-6736(14)60460-8 - DOI - PMC - PubMed
-
- Trayhurn P, Wood IS (2004) Adipokines: inflammation and the pleiotropic role of white adipose tissue. Br J Nutr 92: 347–355. - PubMed
-
- Ling C, Ronn T (2016) Epigenetic markers to further understand insulin resistance. Diabetologia 59: 2295–2297. doi: 10.1007/s00125-016-4109-y - DOI - PubMed
-
- Dagdeviren S, Jung DY, Lee E, Friedline RH, Noh HL, Kim JH, et al. (2016) Altered Interleukin-10 Signaling in Skeletal Muscle Regulates Obesity-Mediated Inflammation and Insulin Resistance. Mol Cell Biol. doi: 10.1128/MCB.00181-16 - DOI - PMC - PubMed
MeSH terms
Substances
LinkOut - more resources
Full Text Sources
Other Literature Sources
Medical
Molecular Biology Databases
