Review
. 2017 Jul;100(4):313-332.
doi: 10.1111/cxo.12551. Epub 2017 Jun 22.

The value of visual field testing in the era of advanced imaging: clinical and psychophysical perspectives

Affiliations
Review

The value of visual field testing in the era of advanced imaging: clinical and psychophysical perspectives

Jack Phu et al. Clin Exp Optom. 2017 Jul.

Abstract

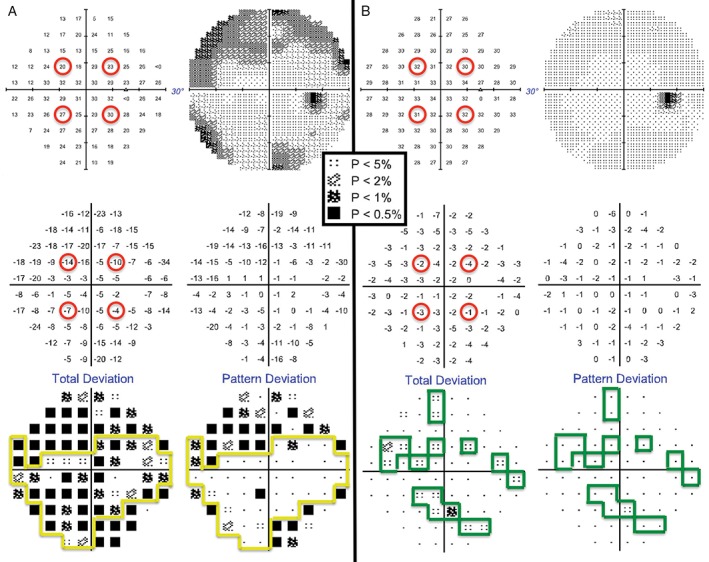
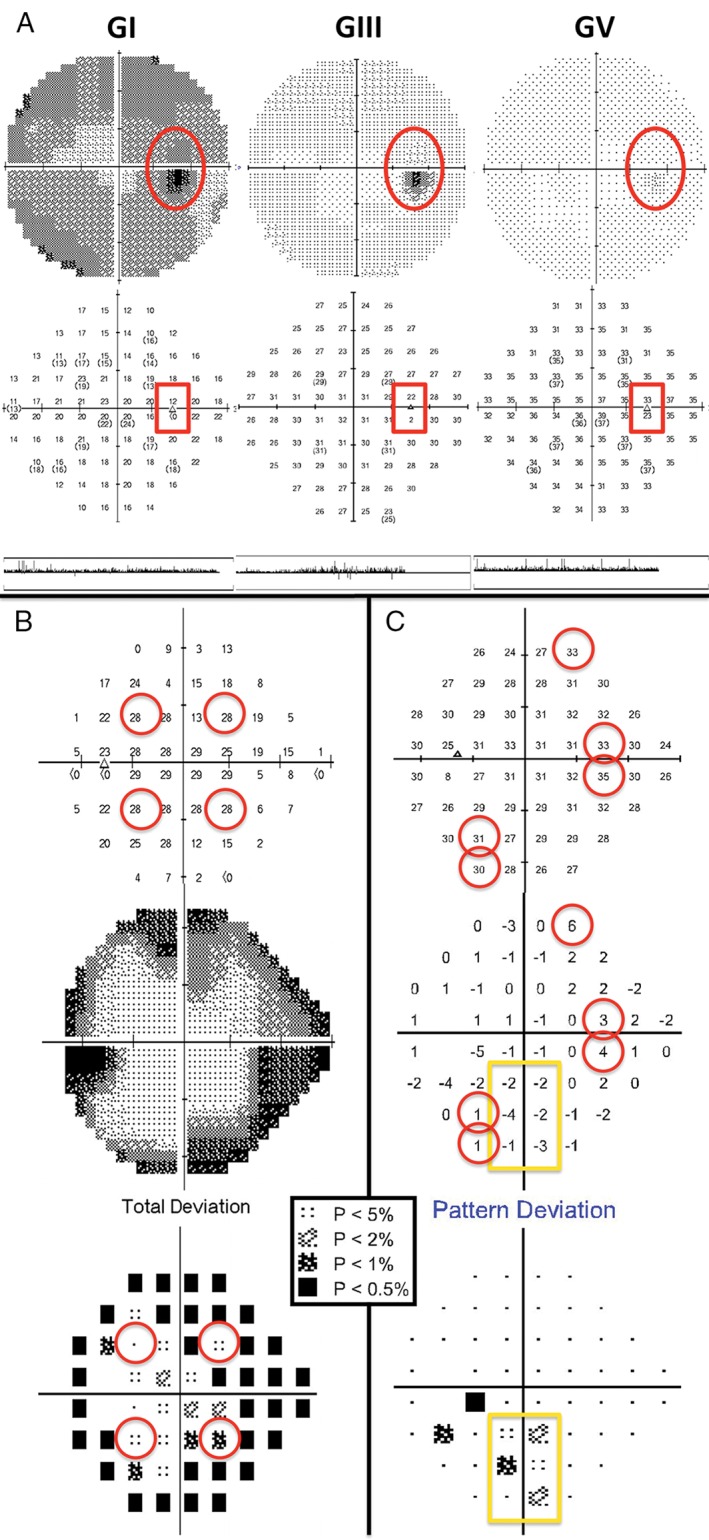
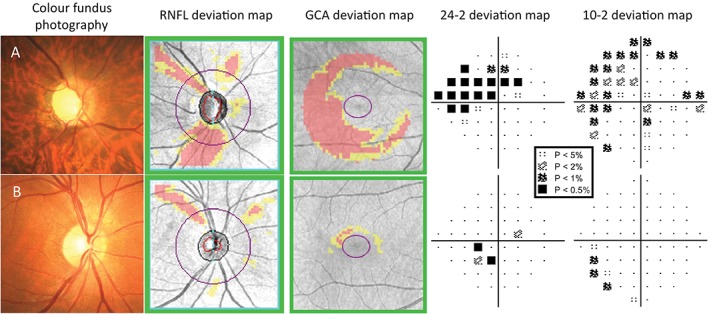
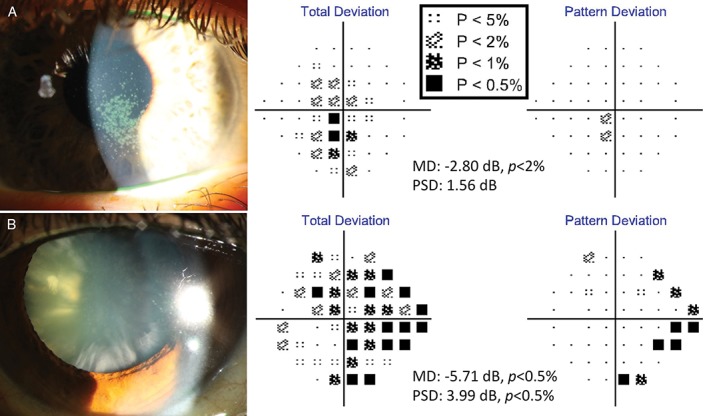
White-on-white standard automated perimetry (SAP) is widely used in clinical and research settings for assessment of contrast sensitivity using incremental light stimuli across the visual field. It is one of the main functional measures of the effect of disease upon the visual system. SAP has evolved over the last 40 years to become an indispensable tool for comprehensive assessment of visual function. In modern clinical practice, a range of objective measurements of ocular structure, such as optical coherence tomography, have also become invaluable additions to the arsenal of the ophthalmic examination. Although structure-function correlation is a highly desirable determinant of an unambiguous clinical picture for a patient, in practice, clinicians are often faced with discordance of structural and functional results, which presents them with a challenge. The construction principles behind the development of SAP are used to discuss the interpretation of visual fields, as well as the problem of structure-function discordance. Through illustrative clinical examples, we provide useful insights to assist clinicians in combining a range of clinical results obtained from SAP and from advanced imaging techniques into a coherent picture that can help direct clinical management.

Keywords: Bloch's law; Ricco's law; glaucoma; optical coherence tomography; perimetry; psychophysics; spatial summation; structure-function; temporal summation; tilted disc syndrome.


Figures

Figure 1
Figure 1
The right eye Humphrey Field Analyzer (HFA) 30–2 SITA‐Standard visual field results for a 13‐year‐old Asian female (top left: thresholds [dB]; top right: greyscale; middle left: difference in dB from normative database; middle right: difference in dB from normative database after subtracting the patient's Hill of Vision [HoV]; bottom left: ‘Total Deviation’ plot, based on the values in the middle left, with probability scale of normality; bottom right: ‘Pattern Deviation’ plot, based on the values in the middle right with probability scale of normality). It was the first time she had undertaken visual field testing (A) and she did not have a good understanding of the task, leading to errors in establishing the initial HoV with the four seeding points (upper left, middle left). After practice and improved task understanding, thresholds at the four seeding locations improved (B). Minor depressions of low significance only appeared in the ‘Total Deviation’ plot (B, lower left) and once the HoV was considered, there was a single significant defect on the ‘Pattern Deviation’ plot (B, lower right). A key for the greyscale levels of probability of normality is shown as an inset.
Figure 2
Figure 2
Reliability measurements in visual field assessment. (A) Errors in blind spot mapping can occur depending on the stimulus size and optic disc size and morphology (Humphrey Field Analyzer [HFA] 30–2 full threshold visual field results: top, greyscale; middle, thresholds [dB]; bottom, gaze tracker. Fixation loss percentages were: Goldmann size I [GI], zero per cent, Goldmann size III [GIII], five per cent and Goldmann size V [GV], 100 per cent). The two test locations marked in the red boxes and by the dark spots on the greyscale are excluded from analysis as they correspond to locations where the blind spot may be tested by the instrument. In the case of GI, the lower of the two points was noted to have less than zero dB for a threshold, while there was no absolute scotoma found with GIII or GV at the same location. In particular, testing using a GV stimulus in this patient could not accurately map the blind spot (100 per cent fixation losses, in comparison to zero fixation losses using GI and five per cent fixation losses using GIII) and fixation had to be monitored using the gaze tracker. (B) A cloverleaf‐type (also known as ‘Mickey Mouse ears’) defect in a patient whose attention waned with increasing test duration. The initial four seeding points (red circles) exhibited only mildly depressed sensitivity or were near normal on the raw threshold map (top) and ‘total deviation’ plot (bottom). Surrounding peripheral points showed more significant depressions, especially on the greyscale plot (middle). This patient exhibited false negative errors of 46 per cent. (C) Higher sensitivity is indicative of a trigger‐happy patient. Manual examination of raw threshold values (top) can reveal these points (red circles), which shift the patient's Hill of Vision higher (middle), producing artificial flagged points on the ‘Pattern Deviation’ plot (yellow box, bottom). A key for the greyscale levels of probability of normality is shown as an inset.
Figure 3
Figure 3
Examples of patients where a 10–2 visual field has helped to determine the extent of the central visual field defect found on the 24–2 (Humphrey Field Analyzer [HFA] SITA‐Standard). A key for the greyscale levels of probability of normality is shown as an inset. (A) The right eye findings of a 54‐year‐old Asian man with moderate normal‐tension glaucoma. The disc size was average, with enlarged vertical cup. There was evidence of inferior neuroretinal rim thinning, with corresponding retinal nerve fibre layer (RNFL) loss on the deviation map and ganglion cell‐inner plexiform layer (GCIPL) thinning on the Ganglion Cell Analysis (GCA) deviation map. The 24–2 visual field showed a superior nasal step defect extending in an arcuate fashion, with points encroaching upon fixation. 10–2 visual field showed the central defect in greater detail, with reductions in sensitivity as near as one degree from fixation. (B) A 46‐year‐old Caucasian man with previous ischaemic attack resulting in superior RNFL loss, as seen in both the fundus photograph and the RNFL deviation map. Although the GCA deviation map showed little significant reduction in GCIPL thickness, the 24–2 visual field deviation map showed points of reduced sensitivity within 10 degrees of fixation. The 10–2 visual field showed that the reduction in sensitivity was located mainly seven to nine degrees from fixation and not within the central five degrees.
Figure 4
Figure 4
Examples of media opacity visual field defects (Humphrey Field Analyzer [HFA] 24–2 SITA‐Standard). (A) The visual field result of a 38‐year‐old Caucasian woman with severe dry eye manifesting as confluent central corneal superficial punctate epitheliopathy. There were significant central total deviation defects with accompanying mean deviation (MD) value flagged at p < 0.02 (−2.80 dB). Some regions of superficial punctate epitheliopathy were dense enough to result in pattern deviation (PD) map defects; however, these focal defects were not numerous or dense enough to result in a significant pattern standard deviation (PSD) value (1.56 dB, p > 0.10). (B) The visual field result of a 63‐year‐old Asian woman with significant mixed cataracts. Her visual acuities were 6/12−2 R and L. In particular, there was a number of dense cortical spoke cataracts. The diffuse defects on the total deviation map were characteristic of a generalised media opacity, while the focal depressions located primarily in the periphery of the PD map were mainly due to the relatively dense peripheral cortical cataracts. As expected, MD scores were depressed at −5.71 dB (p < 0.005) and the extent of PD defects were enough to also flag the PSD score (3.99 dB, p < 0.005). A key for the greyscale levels of probability of normality is shown as an inset.
Figure 5
Figure 5
Examples of retinal pathology causing visual field defects. (A–E) The clinical findings of a 68‐year‐old Asian man who had previously undergone retinopexy and intravitreal anti‐vascular endothelial growth factor injections for right branch retinal vein occlusion. The Cirrus optical coherence tomography (OCT) macular thickness heat map (B) and Ganglion Cell Analysis (GCA) deviation map (C) show reductions in neural tissue in the superior macular region. Autofluorescence (D) also highlights the area of atrophy. In (E), the pattern deviation map from the Humphrey Field Analyzer (HFA) 24–2 SITA‐Standard visual field shows structure‐function concordance with focal depressions in the inferior field. (F–J) The clinical findings of a 29‐year‐old Caucasian man with multiple previous retinal vein occlusions in the right eye secondary to Factor V Leiden hypercoagulability. Dilated fundus examination showed diffuse and widespread haemorrhages, dilated and tortuous retinal veins and optic disc oedema in the right eye (F). Cirrus OCT heat map showed oedema of the inferior macula and thinning of the superior macula (G). Similarly, the GCA deviation map showed thinning superiorly (H). OCT‐angiography imaging showed loss of underlying vasculature in the superior region of thinning, indicative of ischaemia (I). This explained the presence of a clear inferior visual field defect (HFA 30–2 SITA‐Standard) adjacent to fixation and thus structure‐function concordance (J). A key for the greyscale levels of probability of normality is shown as an inset.
Figure 6
Figure 6
Examples of different stages of glaucoma designated by Mills and colleagues,133 with (top to bottom) colour fundus photographs, green‐filtered (red‐free) fundus photographs (yellow arrows indicate areas of retinal nerve fibre layer [RNFL] drop out), Cirrus optical coherence tomography (OCT) RNFL deviation map, Cirrus OCT Ganglion Cell Analysis (GCA) deviation map and Humphrey Field Analyzer (HFA) 24–2 SITA‐Standard pattern deviation map. A key for the greyscale levels of probability of normality is shown as an inset. (A) The right eye findings of a 49‐year‐old Caucasian man with early high‐tension glaucoma. Inferior optic nerve head thinning with corresponding RNFL loss on the deviation map showed structure‐function concordance with the nasal step defect. His HFA mean deviation (MD) score was −4.67 dB (p < 0.005) and pattern standard deviation (PSD) score was 5.19 dB (p < 0.005). (B) The left eye findings of a 60‐year‐old Caucasian woman with moderate high‐tension glaucoma. A predominantly inferior, wide wedge RNFL defect was accompanied by a corresponding superior arcuate defect extending from the nasal region. Her HFA MD score was −8.70 dB (p < 0.005) and PSD score was 13.77 dB (p < 0.005). (C) The right eye findings of a 78‐year‐old Hispanic man with chronic, advanced narrow angle glaucoma. In spite of the large disc, fundoscopic examination showed deeply‐cupped optic nerve head, with almost complete loss of the superior and inferior neuroretinal rim. As expected, there were both superior and inferior arcuate‐type defects across the visual field. Approximately 75 per cent of all points were flagged as below the five per cent level of normality. His MD score was −19.96 dB (p < 0.005). Interestingly, his PSD score was 9.47 dB (p < 0.005), which is apparently ‘better’ than the result in the patient in (B). As PSD is a standard deviation score considering all points across the visual field, the score was not as low as that of the patient in (B) because there are more points of reduced sensitivity.
Figure 7
Figure 7
Examples of patients with optic nerve disease: optic disc pit (A–E), optic nerve head drusen (F–J) and dominant optic atrophy (K–O). (A–E) The right eye results of a 50‐year‐old Asian woman who was referred for glaucoma assessment. The optic nerve appeared small, obliquely inserted and tilted, with significant peripapillary atrophy, which has confounded Cirrus optical coherence tomography (OCT) retinal nerve fibre layer (RNFL) analysis (B). The Cirrus Ganglion Cell Analysis (GCA) deviation map showed an inferior arc‐like defect (C) and the Humphrey Field Analyzer (HFA) 24–2 SITA‐Standard visual field result showed a matching superior arcuate defect (E). Coronal scan with the Spectralis OCT allows visualisation of the pit (D, yellow arrow); however, careful inspection of the optic nerve, aided with stereoscopic viewing, showed an optic disc pit in the inferotemporal region, which has caused the visual field defect. The altitudinal‐like visual field loss was unlikely to be due to glaucoma. (F–J) The right eye results of a 31‐year‐old Caucasian woman who was referred for assessment on the basis of raised optic nerve head. The fundoscopic examination showed a heaped optic nerve, although without obscuration of the blood vessels (F). Cirrus RNFL analysis showed thinning of the adjacent RNFL bundles superiorly, inferiorly and nasally (G). Autofluorescence imaging (Spectralis OCT) showed hyperautofluorescence of the optic nerve, especially in the nasal aspect, characteristic of buried optic nerve head drusen (H), with corresponding hyper‐reflective material on the coronal scan (I, yellow arrows).145 Although the RNFL appeared reduced superiorly, nasally and inferiorly, the HFA 30–2 SITA‐Standard result showed only an inferonasal depression (J). (K–O) The right eye results of a 39‐year‐old Caucasian man with diagnosed dominant optic atrophy. Fundoscopic examination showed an average‐sized disc with enlarged vertical cup and pallor, particularly of the temporal aspect (K). Cirrus OCT RNFL deviation map showed no significant defects (L) but the GCA deviation map showed a generalised reduction in ganglion cell‐inner plexiform layer thickness across the entire scan area (M). Line scan through the fovea showed marked thinning of the RNFL layer (N, yellow arrows). HFA 24–2 SITA‐Standard was performed, as the visual field defects had a centrocaecal pattern (O). A key for the greyscale levels of probability of normality is shown as an inset.
Figure 8
Figure 8
Examples of patients with chiasmal‐type lesions and their visual field defects. Right and left eye fundus photographs and optical coherence tomography (OCT) results have been inverted to portray the visual field results in the conventional method with field on the ipsilateral side, which helps to recognise congruous and symmetrical defects. A key for the greyscale levels of probability of normality for the deviation maps is shown as an inset. (A–E) The clinical findings of a 69‐year‐old Caucasian man with previous pituitary tumour, which had been surgically removed. Fundoscopic examination showed pallor of the temporal neuroretinal rim, right more so than left (A). Cirrus OCT Ganglion Cell Analysis (GCA) deviation map showed thinning in the nasal region in both eyes (B). The Humphrey Field Analyzer (HFA) 30–2 SITA‐Standard results showed isolated clusters of defects that did not follow a typical bitemporal pattern of loss, that is, visual recovery following relief of compression due to the chiasmal lesion (C–E). (F–J) The clinical results of a 27‐year‐old Asian woman who had experienced gradual worsening left vision over the past 2–3 months. Her visual acuities were 6/6−1 R and 6/75+2 L (no improvement with pinhole). Amsler grid testing showed marked loss of the temporal field, particularly of the left eye. Fundoscopic examination showed temporal pallor of the neuroretinal rim, left more so than right (F). Interestingly, Cirrus GCA deviation map showed only mild depression of the temporal region in both eyes which did not appear that severe (G). HFA 24–2 SITA‐Fast (performed due to patient discomfort on the test) visual field results showed almost complete loss of sensitivity in the left eye and a superonasal and temporal defect in the right eye on the greyscale map (H). In this case, the pattern deviation plots were not useful, due to the extensive amount of visual field loss; these did not reveal a specific neurological pattern of loss (J). Instead, examination of the raw threshold values was more informative (I). In the right eye, there was a distinct change in sensitivity about the vertical midline, particularly inferiorly, with the temporal field exhibiting loss of sensitivity at the level of less than zero dB, in comparison to the near‐normal thresholds of around 27 dB in the nasal region. These findings were typical of a progressive chiasmal lesion, with a particular left‐sided bias (pituitary adenoma confirmed causing anterior chiasmal syndrome).
Figure 9
Figure 9
Two examples of patients with tilted disc syndrome. As per the convention of examining visual field results, left eye results are placed on the left and right eye results on the right; hence, the corresponding fundus photographs and optical coherence tomography (OCT) results are also placed on opposite sides to a typical instrument printout. (A) A 76‐year‐old man who was seen for assessment with a suspicious optic nerve head, which appeared tilted and obliquely inserted with clear situs inversus of the blood vessels typical of tilted disc syndrome. Cirrus OCT deviation map results (B) show obvious errors in segmentation of the nasal fundus, as expected of a coloboma in that region. B‐scan ultrasound along the horizontal axis in both eyes show an uneven curvature indicative of a posterior staphyloma in the region of the coloboma (C, yellow arrows). Conventional standard automated perimetry (SAP) testing (Humphrey Field Analyzer [HFA] 24–2 SITA‐Standard) showed a cluster of defects in the nasal region of both eyes which apparently respected the vertical midline (D). The addition of a further −3.25 D lens on top of the patient's near refraction almost completely eliminated the defect, by refocusing rays of light onto the more posteriorly displaced retina (E). Although there was some depression of the nasal, out‐of‐focus portion of the visual field, this did not reach statistical significance. (B) A 27‐year‐old woman with no neurological complaints but progression of myopia in the left eye. Fundoscopic examination showed a more obliquely inserted and tilted disc in the left eye (F, G; note that Cirrus OCT infrared images have been included in lieu of fundus photographs but show the same clinical picture) and subtle coloboma on B‐scan ultrasound (H). In comparison, the right eye showed only a slightly tilted disc (right hand side images). Conventional SAP testing (HFA 30–2 SITA‐Standard) revealed a cluster of defects predominantly in the superotemporal region, left more so than right (I). The addition of a further −3.25 D lens on top of the patient's refraction essentially eliminated the temporal visual field defect (J). Similar to the case shown in (A–E), there was some depression of the nasal, out‐of‐focus portion of the visual field; this did not reach statistical significance. A key for the greyscale levels of probability of normality for the deviation maps is shown as an inset.
Figure 10
Figure 10
Examples of patients with neurological‐based visual field defects but without optic disc changes (for example, pallor; A, F) or ganglion cell loss on the Ganglion Cell Analysis (GCA) maps (B, G). Humphrey Visual Field Analyzer greyscale (C, H), thresholds (D, I), total deviation map (E) and pattern deviation map (J), with corresponding Glaucoma Hemifield Test, mean deviation and pattern standard deviation results are shown. A key for the greyscale levels of probability of normality for the deviation maps is shown as an inset. (A–E) A 70‐year‐old Caucasian man who was found to have a left inferior homonymous quadrantonopia. (F–J) A 48‐year‐old Caucasian male patient who underwent ophthalmic examination following an episode of occipital lobe cerebral vascular accident seven weeks earlier. There was a right homonymous hemianopia plus constriction of the left superior and inferior fields, sparing the central region of the left field in both eyes. A key for the greyscale levels of probability of normality for the deviation maps is shown as an inset.
Figure 11
Figure 11
The right (A–E) and left (F–J) eye clinical findings of a 60‐year‐old Asian woman with bilateral glaucoma. A key for the greyscale levels of probability of normality is shown as an inset. Optic nerve head examination showed small‐sized, tilted discs with inferotemporal thinning of the neuroretinal rim (A, F) and corresponding retinal nerve fibre layer (RNFL) loss in both eyes as shown by the yellow arrows (B, G). Cirrus optical coherence tomography (OCT) RNFL deviation map showed more obvious RNFL loss in the right eye (C) compared to the left (H), due to the presence of eye movement artefacts. Cirrus OCT Ganglion Cell Analysis (GCA) deviation map showed inferior arc‐shaped defects of ganglion cell‐inner plexiform layer loss, left (I) more so than right (D). Humphrey Field Analyzer (HFA) 24–2 SITA‐Standard deviation map results showed structural‐function correlation in the right eye, with a superior nasal step (E). The mean deviation (MD) score was 0.12 dB (p > 0.05), the pattern standard deviation (PSD) score was 2.02 dB (p < 0.05) and the Glaucoma Hemifield Test (GHT) was marked as ‘outside normal limits’. In comparison, there was no structure‐function correlation in the left eye, with only isolated points of reduced sensitivity (J). Global indices were also essentially within normal limits: MD score was −0.06 dB (p > 0.05), PSD score was 1.74 dB (p > 0.05) and the GHT was ‘within normal limits’.
Figure 12
Figure 12
The right eye clinical results of a 58‐year‐old Asian man with normal‐tension glaucoma. Some of this patient's results have been previously reported in Kalloniatis and Khuu32 (Table 1, patient E). The fundus examination showed a small disc with clear optic nerve head cupping, superior and inferior neuroretinal rim thinning and retinal nerve fibre layer (RNFL) drop out. Imaging results from the Cirrus optical coherence tomography (OCT) RNFL and Ganglion Cell Analysis (GCA) deviation maps concurred with the fundoscopic examination. Humphrey Field Analyzer (HFA) 30–2 full threshold results for Goldmann sizes I–V are shown below. For clarity in discerning the location and depth of defect, greyscales are shown. Using a standard Goldmann size III stimulus, there was a typical glaucomatous nasal step defect. When using larger stimulus sizes (IV and V), the greyscale appears lighter and smaller in extent, indicative of less visual field loss detected. Conversely, utilising a smaller stimulus size (I and II) shows a wider and deeper extent of visual field loss detected in the nasal region. A central reference point is used in the HFA to depict regions of visual field loss for non‐standard Goldmann sizes (I, II, IV and V) and as such, these are not directly interchangeable with standard size III for comparisons.8 Importantly, these total ‘defects’ do not represent a normalised defect, accounting for regional variations across the VF (see: Kalloniatis and Khuu,32 Heijl and colleagues179 and Russell and colleagues180) but rather a coarse comparison with a normal reference and an obvious size‐dependent effect. An age‐matched normal subject's (‘control’) total ‘defect’ results are shown below the results of the glaucoma patient.
Figure 13
Figure 13
Spatial summation functions for the same patient shown in Figure 12. Humphrey Field Analyzer (HFA) thresholds have been converted into equivalent Weber contrast levels on the y‐axis (as per Khuu and Kalloniatis5) with stimulus sizes expressed in log degrees2 on the x‐axis. Five points represent the thresholds obtained using each available Goldmann stimulus size on the HFA and the line represents the segmental non‐linear regression with an initial slope fixed at −1, representing the region of complete spatial summation. The dashed lines indicate the critical area (Ac) for normal (black, AcN) and disease (red, AcD) at the two representative locations. The red squares denote the thresholds of the patient with glaucoma and the black circles indicate a group of age‐equivalent normal patients (error bars denote the 95 per cent distribution limits). Two representative locations are shown, coloured coded according to the inset visual field pattern deviation map. For the blue test location, all sizes show a statistically significant elevation in threshold (marked with asterisks) but stimuli that are within complete spatial summation (that is, the slope of −1) have the greatest threshold elevation. For the green test location, only Goldmann sizes I and II had significant threshold elevation (*), while Goldmann sizes III–V were not significant (ns).

References

    1. Traquair HM. An Introduction to Clinical Perimetry. London: Henry Kimpton, 1927.
    1. Traquair HM. Clinical detection of early changes in the visual field. Trans Am Ophthalmol Soc 1939; 37: 158–179. - PMC - PubMed
    1. Schiefer U, Patzold J, Dannheim F. [Conventional techniques of visual field examination Part 2: confrontation visual field testing ‐ kinetic perimetry]. Ophthalmologe 2005; 102: 821–827. - PubMed
    1. Spector RH. Visual fields In: Walker HK, Wall WD, Hurst JW. eds. Clinical Methods: The History, Physical and Laboratory Examinations, 3rd edn. Boston: Butterworths, 1990. - PubMed
    1. Khuu SK, Kalloniatis M. Standard automated perimetry: determining spatial summation and its effect on contrast sensitivity across the visual field. Invest Ophthalmol Vis Sci 2015; 56: 3565–3576. - PubMed