

Identifying mechanisms driving formation of granuloma-associated fibrosis during Mycobacterium tuberculosis infection
- PMID: 28642013
- PMCID: PMC5576548
- DOI: 10.1016/j.jtbi.2017.06.017
Identifying mechanisms driving formation of granuloma-associated fibrosis during Mycobacterium tuberculosis infection
Abstract
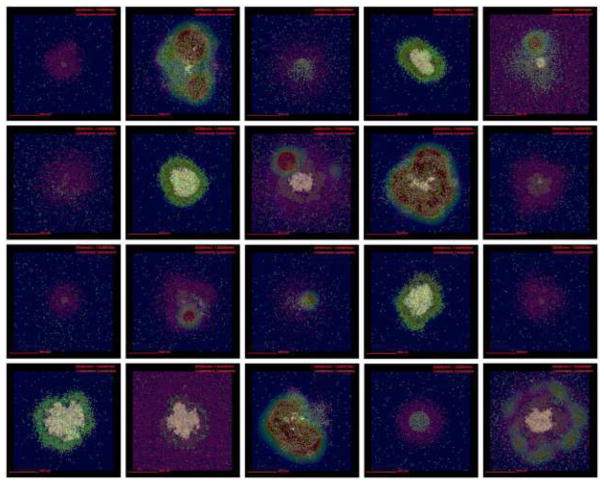
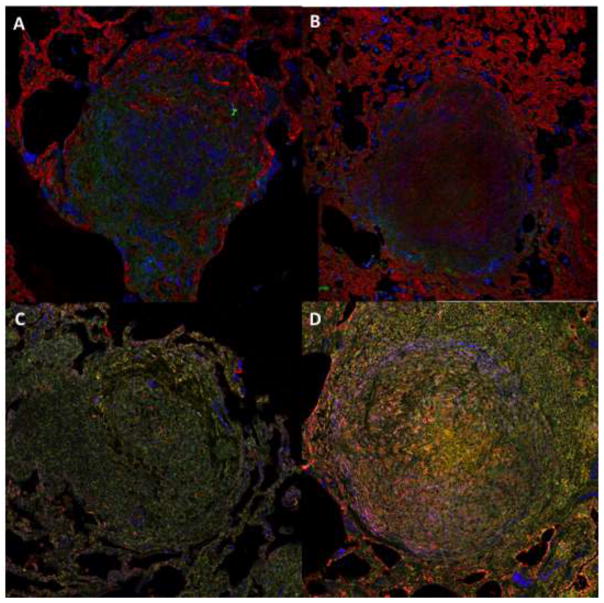
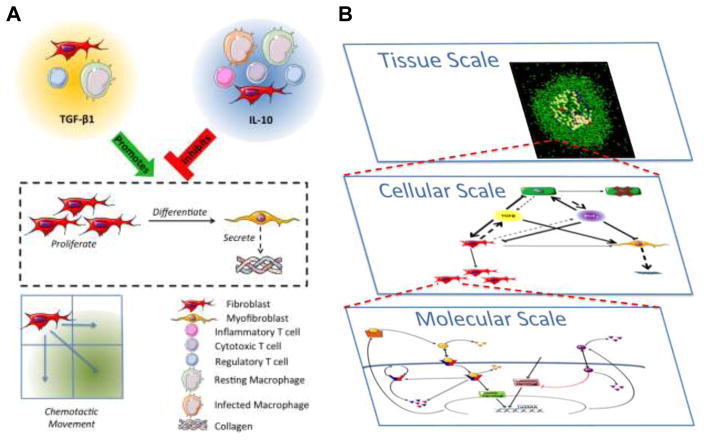
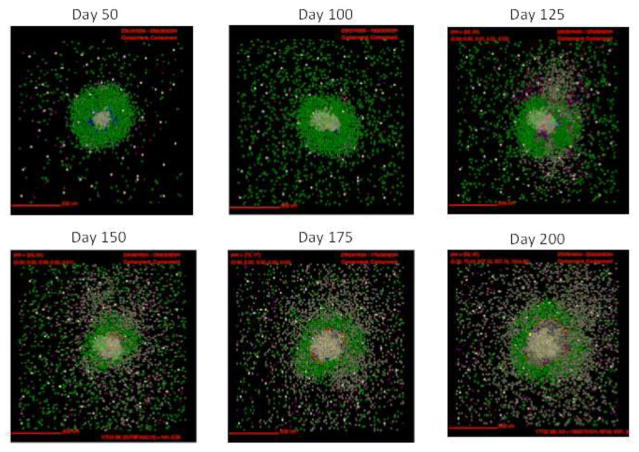
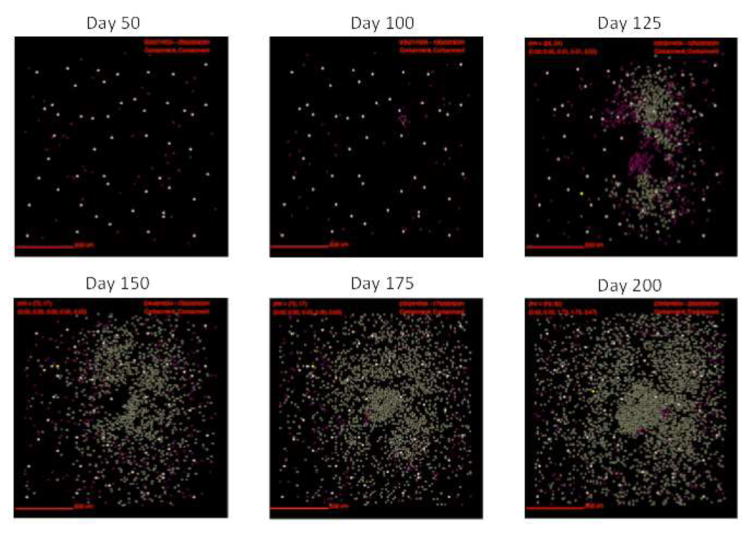
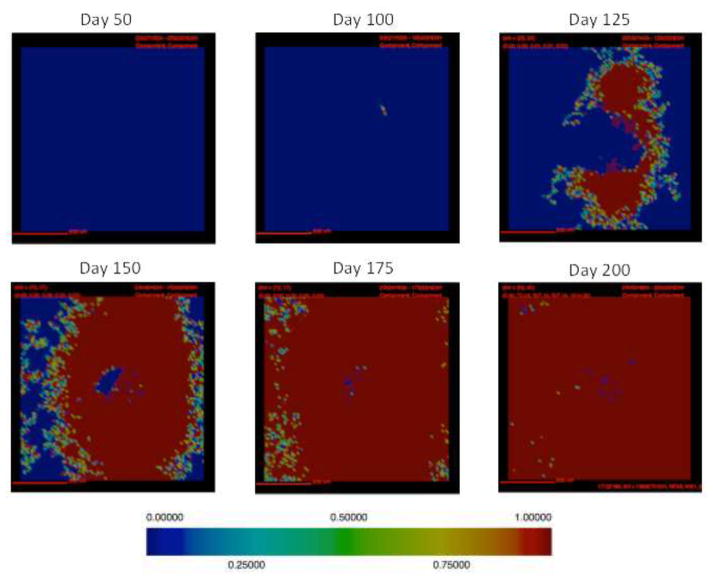
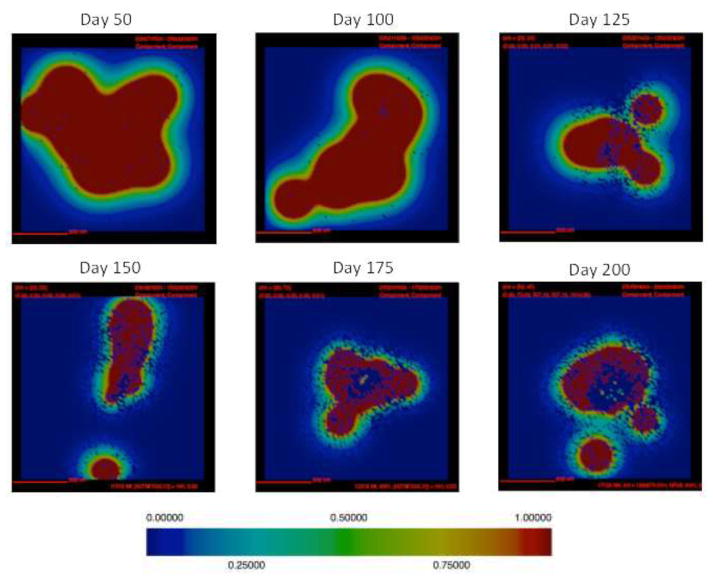
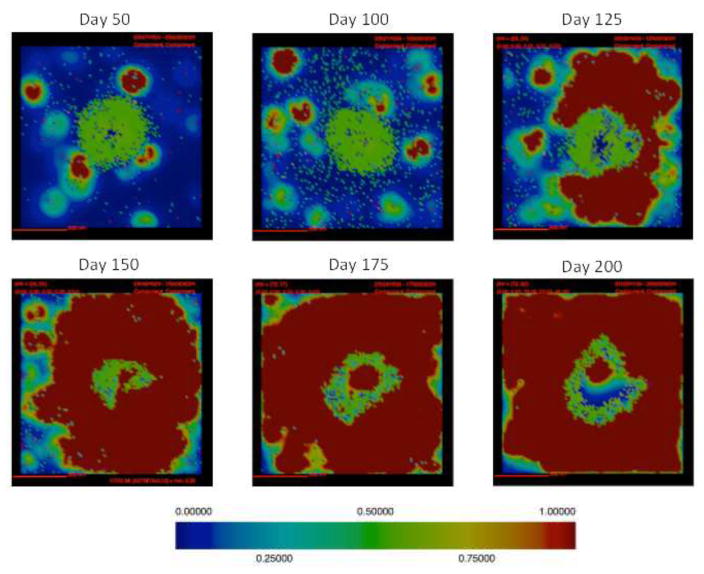
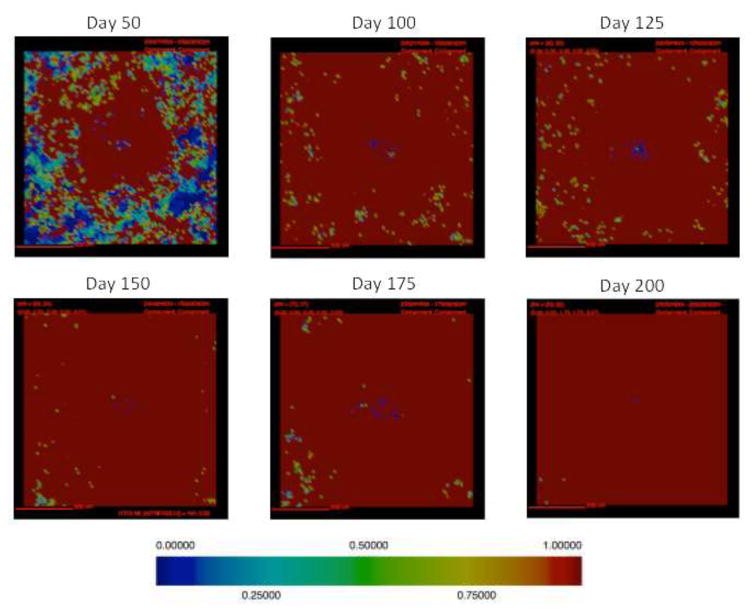
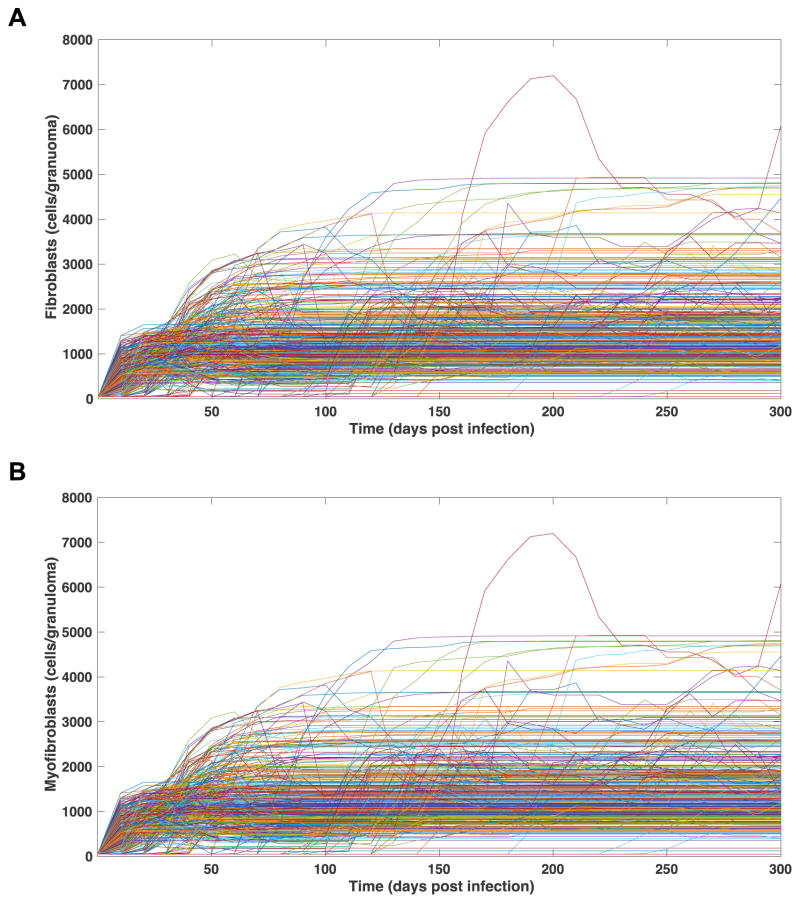
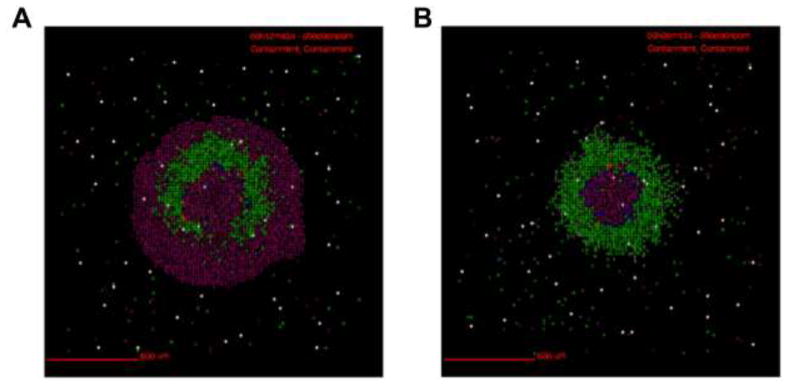
Mycobacterium tuberculosis (Mtb), the causative agent of tuberculosis (TB), is a pulmonary pathogen of major global concern. A key feature of Mtb infection in primates is the formation of granulomas, dense cellular structures surrounding infected lung tissue. These structures serve as the main site of host-pathogen interaction in TB, and thus to effectively treat TB we must clarify mechanisms of granuloma formation and their function in disease. Fibrotic granulomas are associated with both good and bad disease outcomes. Fibrosis can serve to isolate infected tissue from healthy tissue, but it can also cause difficulty breathing as it leaves scars. Little is known about fibrosis in TB, and data from non-human primates is just beginning to clarify the picture. This work focuses on constructing a hybrid multi-scale model of fibrotic granuloma formation, in order to identify mechanisms driving development of fibrosis in Mtb infected lungs. We combine dynamics of molecular, cellular, and tissue scale models from previously published studies to characterize the formation of two common sub-types of fibrotic granulomas: peripherally fibrotic, with a cuff of collagen surrounding granulomas, and centrally fibrotic, with collagen throughout granulomas. Uncertainty and sensitivity analysis, along with large simulation sets, enable us to identify mechanisms differentiating centrally versus peripherally fibrotic granulomas. These findings suggest that heterogeneous cytokine environments exist within granulomas and may be responsible for driving tissue scale morphologies. Using this model we are primed to better understand the complex structure of granulomas, a necessity for developing successful treatments for TB.
Copyright © 2017 Elsevier Ltd. All rights reserved.
Figures

Similar articles
-
A computational model tracks whole-lung Mycobacterium tuberculosis infection and predicts factors that inhibit dissemination.PLoS Comput Biol. 2020 May 20;16(5):e1007280. doi: 10.1371/journal.pcbi.1007280. eCollection 2020 May. PLoS Comput Biol. 2020. PMID: 32433646 Free PMC article.
-
Systems biology predicts that fibrosis in tuberculous granulomas may arise through macrophage-to-myofibroblast transformation.PLoS Comput Biol. 2020 Dec 28;16(12):e1008520. doi: 10.1371/journal.pcbi.1008520. eCollection 2020 Dec. PLoS Comput Biol. 2020. PMID: 33370784 Free PMC article.
-
Spatial transcriptomic sequencing reveals immune microenvironment features of Mycobacterium tuberculosis granulomas in lung and omentum.Theranostics. 2024 Sep 23;14(16):6185-6201. doi: 10.7150/thno.99038. eCollection 2024. Theranostics. 2024. PMID: 39431015 Free PMC article.
-
Understanding the development of tuberculous granulomas: insights into host protection and pathogenesis, a review in humans and animals.Front Immunol. 2024 Dec 9;15:1427559. doi: 10.3389/fimmu.2024.1427559. eCollection 2024. Front Immunol. 2024. PMID: 39717773 Free PMC article. Review.
-
The lung microbiome, vitamin D, and the tuberculous granuloma: A balance triangle.Microb Pathog. 2019 Jun;131:158-163. doi: 10.1016/j.micpath.2019.03.041. Epub 2019 Apr 3. Microb Pathog. 2019. PMID: 30953746 Review.
Cited by
-
Liposomal Glutathione Helps to Mitigate Mycobacterium tuberculosis Infection in the Lungs.Antioxidants (Basel). 2022 Mar 30;11(4):673. doi: 10.3390/antiox11040673. Antioxidants (Basel). 2022. PMID: 35453358 Free PMC article.
-
An atlas overview of characteristic features of tuberculosis that may be encountered at autopsy.Forensic Sci Med Pathol. 2020 Mar;16(1):143-151. doi: 10.1007/s12024-019-00161-y. Epub 2019 Aug 30. Forensic Sci Med Pathol. 2020. PMID: 31471869 Review.
-
Reinventing the human tuberculosis (TB) granuloma: Learning from the cancer field.Front Immunol. 2022 Dec 15;13:1059725. doi: 10.3389/fimmu.2022.1059725. eCollection 2022. Front Immunol. 2022. PMID: 36591229 Free PMC article. Review.
-
Ocular mycobacterial lesions in cats.Vet Pathol. 2022 Sep;59(5):792-805. doi: 10.1177/03009858221098431. Epub 2022 May 19. Vet Pathol. 2022. PMID: 35587045 Free PMC article.
-
On-Slide Heat Sterilization Enables Mass Spectrometry Imaging of Tissue Infected with High-Threat Pathogens Outside of Biocontainment: A Study Directed at Mycobacterium tuberculosis.J Am Soc Mass Spectrom. 2021 Nov 3;32(11):2664-2674. doi: 10.1021/jasms.1c00205. Epub 2021 Oct 21. J Am Soc Mass Spectrom. 2021. PMID: 34672552 Free PMC article.
References
-
- WHO, editor. Global tuberculosis report 2015. 20. Geneva: World Health Organization; 2015.
-
- Dorhoi A, Reece ST, Kaufmann SH. For better or for worse: the immune response against Mycobacterium tuberculosis balances pathology and protection. Immunol Rev. 2011;240(1):235–51. - PubMed
-
- Ramakrishnan L. Revisiting the role of the granuloma in tuberculosis. Nat Rev Immunol. 2012;12(5):352–66. - PubMed
-
- Mattila JT, Ojo OO, Kepka-Lenhart D, Marino S, Kim JH, Eum SY, Via LE, Barry CE, 3rd, Klein E, Kirschner DE, Morris SM, Jr, Lin PL, Flynn JL. Microenvironments in tuberculous granulomas are delineated by distinct populations of macrophage subsets and expression of nitric oxide synthase and arginase isoforms. J Immunol. 2013;191(2):773–84. - PMC - PubMed
-
- Gideon HP, Phuah J, Myers AJ, Bryson BD, Rodgers MA, Coleman MT, Maiello P, Rutledge T, Marino S, Fortune SM, Kirschner DE, Lin PL, Flynn JL. Variability in tuberculosis granuloma T cell responses exists, but a balance of pro- and anti-inflammatory cytokines is associated with sterilization. PLoS Pathog. 2015;11(1):e1004603. - PMC - PubMed
Publication types
MeSH terms
Substances
Grants and funding
LinkOut - more resources
Full Text Sources
Other Literature Sources
Medical
Research Materials
