. 2017 Aug;37(8):1470-1481.
doi: 10.1161/ATVBAHA.117.309672. Epub 2017 Jun 22.

Mediator 1 Is Atherosclerosis Protective by Regulating Macrophage Polarization

Affiliations

Mediator 1 Is Atherosclerosis Protective by Regulating Macrophage Polarization

Liang Bai et al. Arterioscler Thromb Vasc Biol. 2017 Aug.

Abstract

Objective: MED1 (mediator 1) interacts with transcription factors to regulate transcriptional machinery. The role of MED1 in macrophage biology and the relevant disease state remains to be investigated.

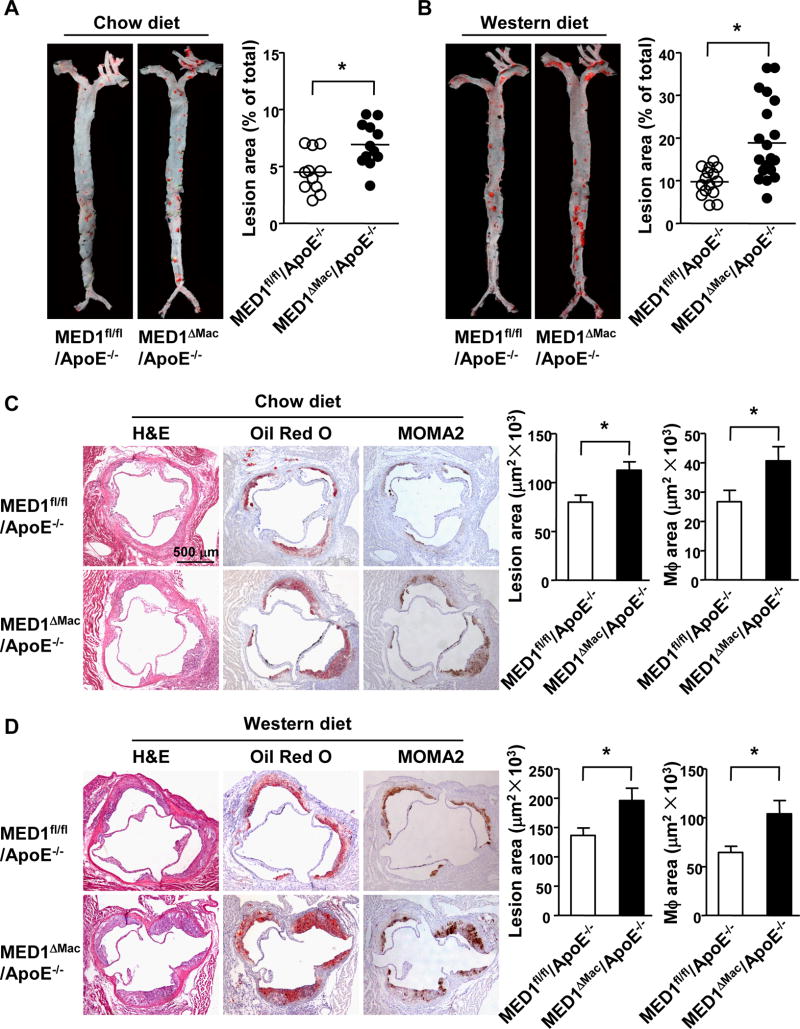
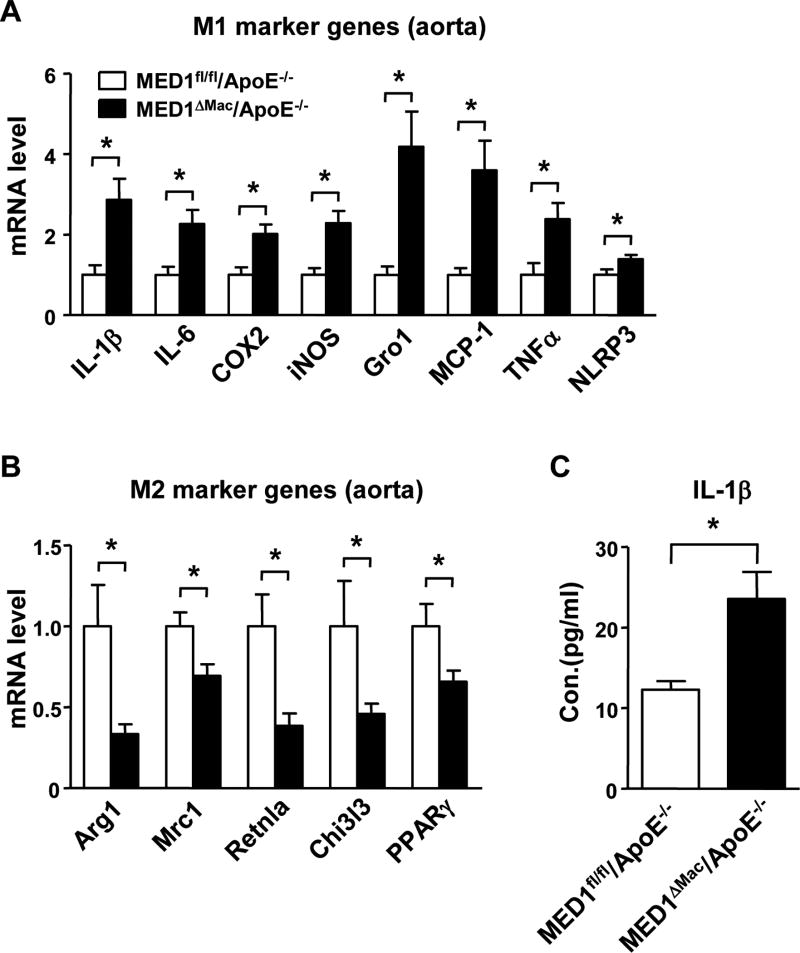
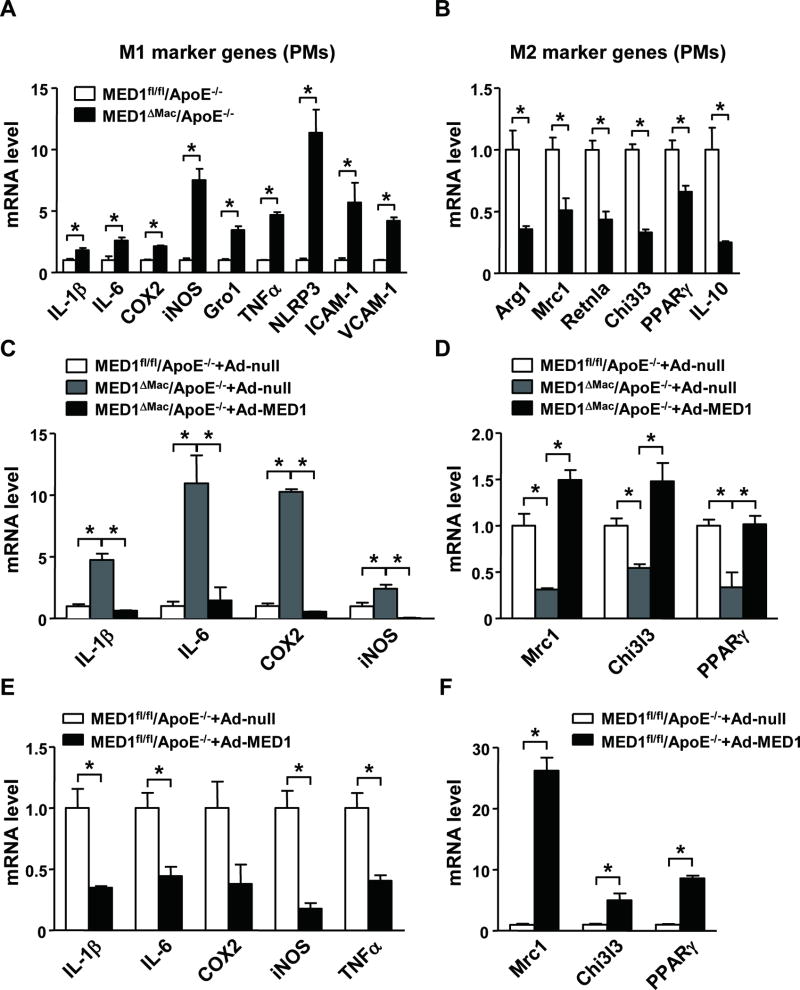
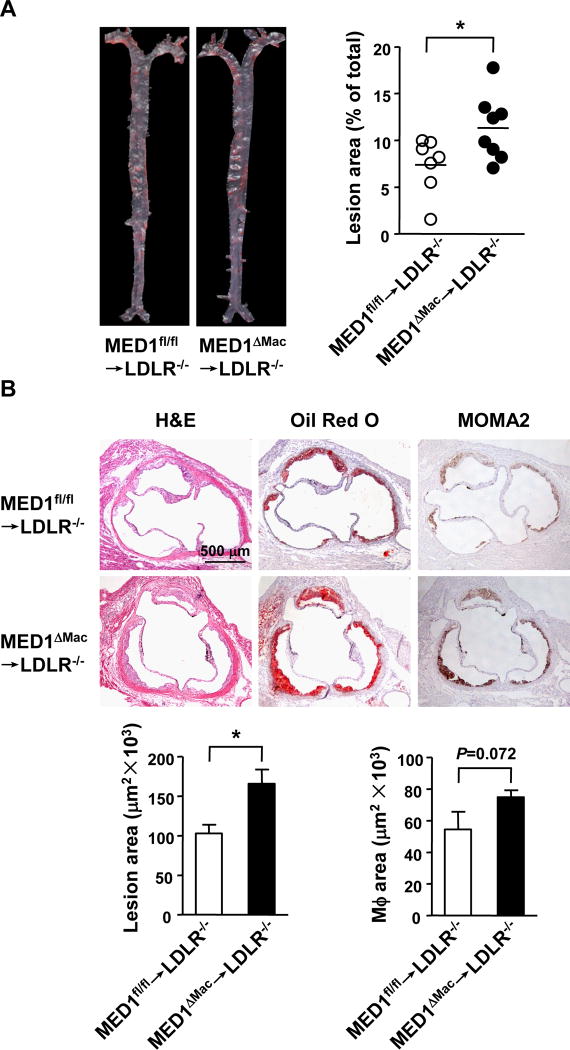
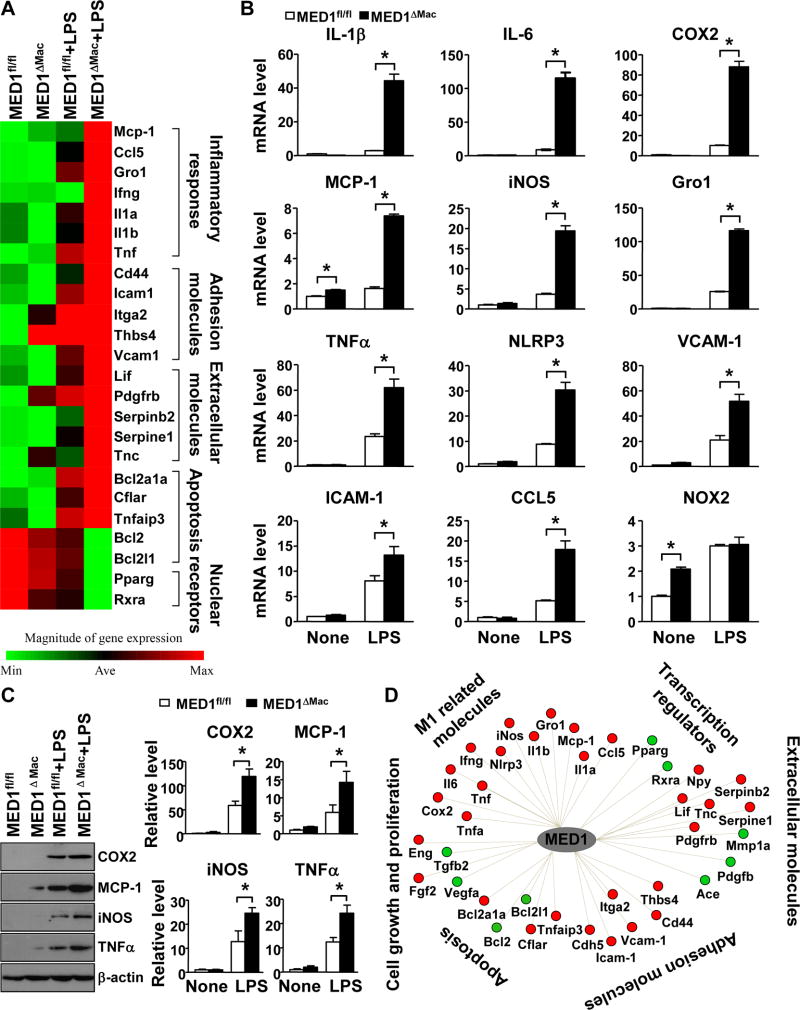
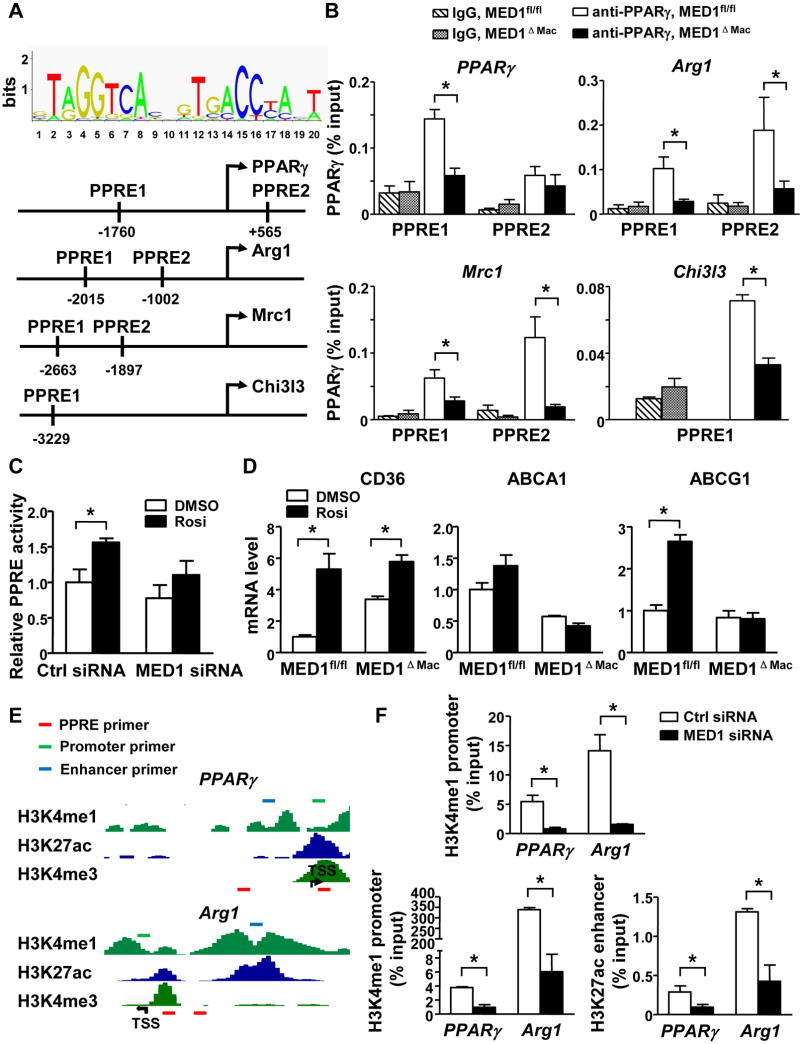
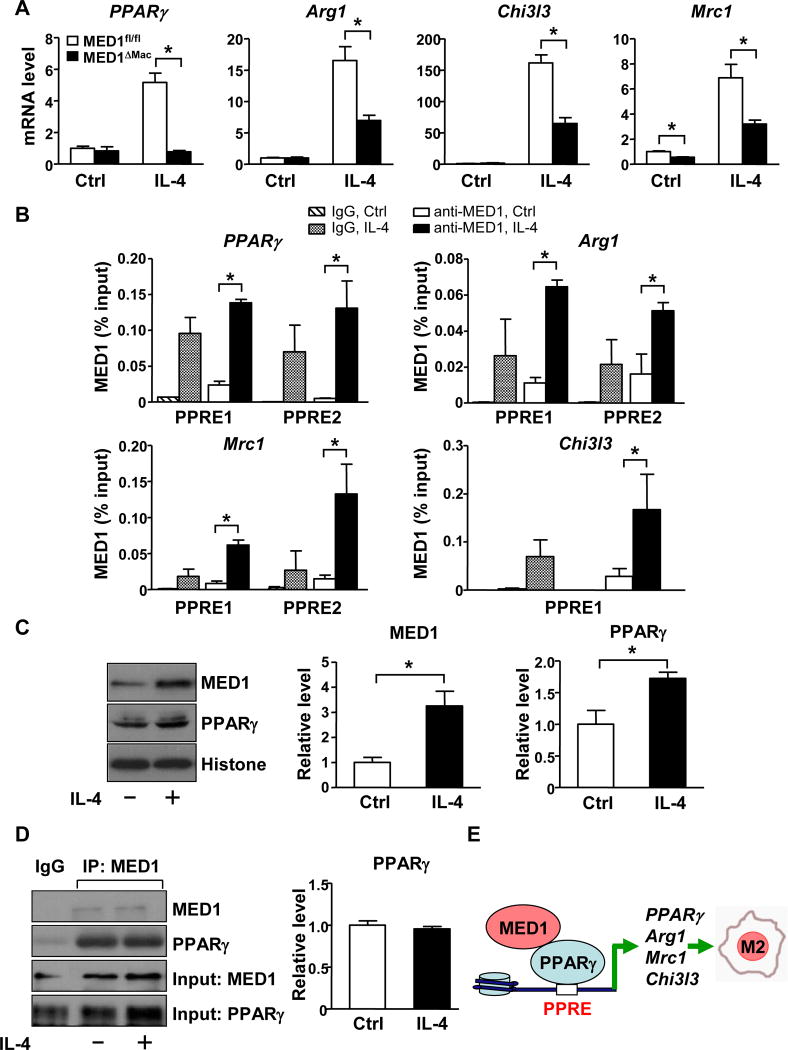
Approach and results: To study the molecular mechanism by which MED1 regulates the M1/M2 phenotype switch of macrophage and the effect on atherosclerosis, we generated MED1/apolipoprotein E (ApoE) double-deficient (MED1ΔMac/ApoE-/-) mice and found that atherosclerosis was greater in MED1ΔMac/ApoE-/- mice than in MED1fl/fl/ApoE-/- littermates. The gene expression of M1 markers was increased and that of M2 markers decreased in both aortic wall and peritoneal macrophages from MED1ΔMac/ApoE-/- mice, whereas MED1 overexpression rectified the changes in M1/M2 expression. Moreover, LDLR (low-density lipoprotein receptor)-deficient mice received bone marrow from MED1ΔMac mice showed greater atherosclerosis. Mechanistically, MED1 ablation decreased the binding of PPARγ (peroxisome proliferator-activated receptor γ) and enrichment of H3K4me1 and H3K27ac to upstream region of M2 marker genes. Furthermore, interleukin 4 induction of PPARγ and MED1 increased the binding of PPARγ or MED1 to the PPAR response elements of M2 marker genes.

Conclusions: Our data suggest that MED1 is required for the PPARγ-mediated M2 phenotype switch, with M2 marker genes induced but M1 marker genes suppressed. MED1 in macrophages has an antiatherosclerotic role via PPARγ-regulated transactivation.

Keywords: apolipoproteins; atherosclerosis; interleukins; macrophages; transcription factors.


Figures

Figure 1
Figure 1. MED1 deficiency in monocytes/macrophages promotes atherosclerosis in mice
Eight-week old MED1fl/fl/ApoE−/− male mice and age-matched MED1ΔMac/ApoE−/− male littermates were fed a chow (n=11 and n=12, respectively) or Western diet (n=15 and n=21, respectively) for 12 weeks. (A, B) En face Oil Red O staining of aortic specimens. (C, D) Cross sections of aortic roots from mice stained with hematoxylin and eosin (H&E), Oil Red O (atherosclerosis), or MOMA2 (macrophage) antibody (n =8–12 mice per group). Data are mean±SEM. * p<0.05.
Figure 2
Figure 2. MED1 deficiency in monocyte/macrophages aggravates inflammatory response in the aorta
(A) RT-qPCR analysis of the mRNA level of M1 marker genes (IL-1β, IL-6, COX2, iNOS, and Gro1), MCP-1, TNFα, and NLRP3 and (B) M2 marker genes (Arg1, Mrc1, Retnla, Chi3l3, and PPARγ) in aortas of MED1fl/fl/ApoE−/− mice and their MED1ΔMac/ApoE−/− littermates (n=8 in each group) fed a Western diet for 12 weeks. (C) ELISA of the plasma level of IL-1β in MED1fl/fl/ApoE−/− and MED1ΔMac/ApoE−/− mice (n=17 and n=22, respectively). Data are mean±SEM from 3 independent experiments. In (A, B), the levels of mRNA are compared with those in MED1fl/fl/ApoE−/− mice set to 1. *p< 0.05.
Figure 3
Figure 3. MED1 deficiency promotes macrophage M1 polarization
(A, B) Peritoneal macrophages were isolated from MED1fl/fl/ApoE−/− mice and MED1ΔMac/ApoE−/− littermates (n=6 in each group). RT-qPCR analysis of the mRNA level of M1 and M2 marker genes in pooled macrophages. (C, D) Peritoneal macrophages pooled from 6 MED1ΔMac/ApoE−/−mice or 6 MED1fl/fl/ApoE−/− littermates were infected with Ad-null (50 multiplicity of infection [MOI]) or Ad-MED1 (50 MOI). (E, F) RT-qPCR analysis of mRNA levels of (E) IL-1β, IL-6, COX2, iNOS, TNFα and (F) Mrc1, Chi3l3, and PPARγ in MED1fl/fl/ApoE−/− macrophages infected with Ad-null or Ad-MED1. In (A–D), the levels of mRNA were compared to those in MED1fl/fl/ApoE−/− macrophages set to 1. In E and F, the Ad-null infected levels were set to 1. Data are mean±SEM from 3 independent experiments. *p< 0.01.
Figure 4
Figure 4. MED1 deficiency in macrophages increases atherosclerosis in LDLR−/− mice
Bone marrow from MED1fl/fl or MED1ΔMac donor mice were transplanted to 8-week-old and lethally irradiated LDLR−/− male mice [MED1fl/fl→LDLR−/− (n=7) and MED1ΔMac→LDLR−/− (n=8)]. After a 6-week chow diet then 12-week Western diet, recipient mice were killed. Atherosclerotic lesion areas in the aorta tree (A) and aortic roots (B) were analyzed and data are presented as mean±SEM. * p<0.05.
Figure 5
Figure 5. MED1 deficiency in macrophages potentiates an inflammatory response
Peritoneal macrophages isolated from MED1fl/fl and MED1ΔMac mice were treated with or without LPS (50 ng/ml) for 6 hr. (A) Heat map from microarray assay shows up- and downregulation of selected atherosclerosis-related genes. (B) qPCR analysis of the mRNA level of the indicated genes. All experiments were repeated 3 times (n=6 per group). * p<0.05. (C) Western blot analysis of the expression of COX2, MCP-1, iNOS, and TNFα. β-actin was used as loading control. Samples were pooled from 6 animals in each of the indicated groups. * p<0.05. (D) Cytoscape reconstruction of the MED1-related gene regulatory network summarizing results in A and B. Red and green circles represent up- and downregulated genes with MED1 deficiency in macrophages.
Figure 6
Figure 6. MED1 mediates PPARγ-induced M2 genes
(A) Bioinformatics analysis of PPREs in the upstream region of M2 marker genes (PPARγ, Arg1, Mrc1, and Chi3l3). (B) PMs were isolated from MED1fl/fl and MED1ΔMac mice, and then nuclear extracts were obtained. ChIP assay was performed with the use of anti-PPARγ to detect PPARγ enrichment at the upstream region of the PPARγ, Arg1, Mrc1, and Chi3l3 gene. IgG was used as the isotype control. The primer sets used in qPCR were sequences adjacent to the predicted PPREs. Bar graphs represent the binding of PPARγ as % of input. (C) RAW264.7 cells were transfected with PPRE-TK-luc reporter constructs together with control or MED1 siRNA. The transfected cells were then stimulated with PPARγ agonist rosiglitazone (Rosi) (10 mM) for 24 hr. Luciferase activity was measured and normalized to that of β-gal. (D) qPCR was performed to detect the mRNA level of CD36, ABCA1 and ABCG1 in MED1fl/fl and MED1ΔMac macrophages treated with Rosi. Graphs represent mean±SEM from 6 mice per group. * p<0.05. (E) The epigenetic landscapes of the upstream region of mouse PPARγ and Arg1 [obtained from http://epgg-test.wustl.edu/d/mm9/ENCFF001JYI.bigWig,(H3K4me1), http://epgg-test.wustl.edu/d/mm9/ENCFF001JYV.bigWig,(H3K27ac) and http://epgg-test.wustl.edu/d/mm9/ENCFF001JYO.bigWig (H3K4me3)]. The red, green, and blue boxes represent the locations of primers detecting the respective PPRE, promoter, and enhancer. (F) RAW264.7 cells were transfected with control or MED1 siRNA. ChIP assay of the respective enrichment of H3K4me1 and H3K27ac on the promoter and enhancer; H3K27ac on the enhancer of the PPARγ and Arg1 gene. Data represent as % of input and are mean±SEM from 3 independent experiments * p<0.05.
Figure 7
Figure 7. IL-4 induction of M2 marker genes is MED1-dependent
Peritoneal macrophages isolated from MED1fl/fl and MED1ΔMac mice (A) and RAW264.7 cells (B–D) were treated with or without IL-4 (10 ng/ml) for 16 hr. (A) RT-qPCR of the mRNA level of PPARγ, Arg1, Chi3l3, and Mrc1 compared with MED1fl/fl without IL-4 set to 1. (B) ChIP assay was performed to detect the enrichment of MED1 at the predicted PPREs of PPARγ, Arg1, Chi3l3, and Mrc1. IgG was used as the isotype control. Bar graphs represent the binding of MED1 as % of input. (C) Western blot analysis of the protein level of MED1 and PPARγ. Histone bands indicate the loading control. (D) MED1 was immunoprecipitated, then immunoblotted with anti-MED1 or anti-PPARγ antibody. In (A–D), data are mean±SEM from at least three independent experiments, * p<0.05. The bar graphs represent the comparison with those without IL-4 treatment set to 1. (E) A graphic presentation of the mechanism by which MED1 in macrophages is atheroprotective through its regulation of macrophage polarization.

References

    1. Conaway RC, Sato S, Tomomori-Sato C, Yao T, Conaway JW. The mammalian Mediator complex and its role in transcriptional regulation. Trends Biochem Sci. 2005;30:250–255. - PubMed
    1. Kornberg RD. Mediator and the mechanism of transcriptional activation. Trends Biochem Sci. 2005;30:235–239. - PubMed
    1. Whyte WA, Orlando DA, Hnisz D, Abraham BJ, Lin CY, Kagey MH, Rahl PB, Lee TI, Young RA. Master transcription factors and mediator establish super-enhancers at key cell identity genes. Cell. 2013;153:307–319. - PMC - PubMed
    1. Zhu Y, Qi C, Jain S, Rao MS, Reddy JK. Isolation and characterization of PBP, a protein that interacts with peroxisome proliferator-activated receptor. J Biol Chem. 1997;272:25500–25506. - PubMed
    1. Chen W, Roeder RG. The Mediator subunit MED1/TRAP220 is required for optimal glucocorticoid receptor-mediated transcription activation. Nucleic Acids Res. 2007;35:6161–6169. - PMC - PubMed

Publication types

MeSH terms