. 2017 Aug;5(8):666-675.
doi: 10.1158/2326-6066.CIR-17-0081. Epub 2017 Jun 22.

Modulation of Endoplasmic Reticulum Stress Controls CD4+ T-cell Activation and Antitumor Function

Affiliations

Modulation of Endoplasmic Reticulum Stress Controls CD4+ T-cell Activation and Antitumor Function

Jessica E Thaxton et al. Cancer Immunol Res. 2017 Aug.

Abstract

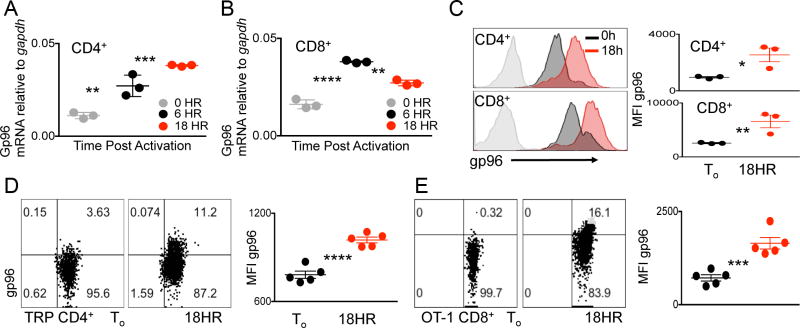
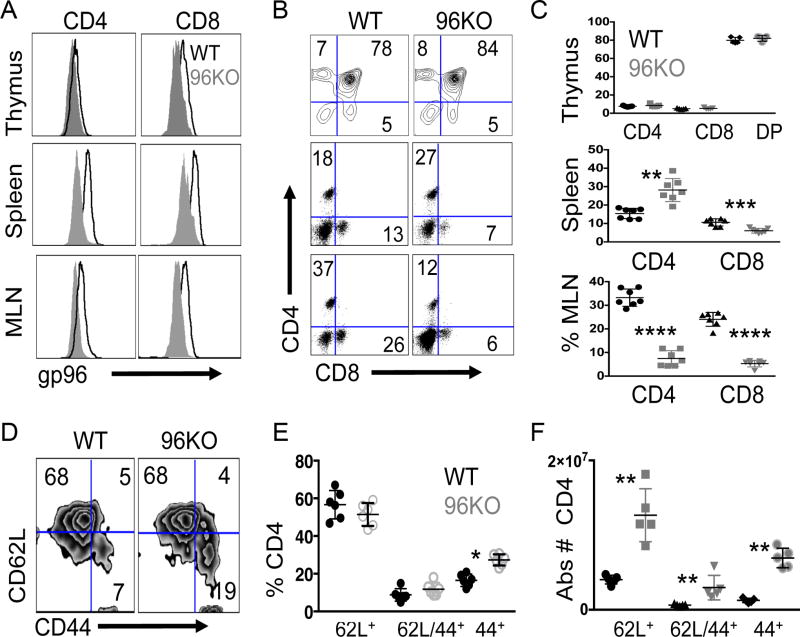
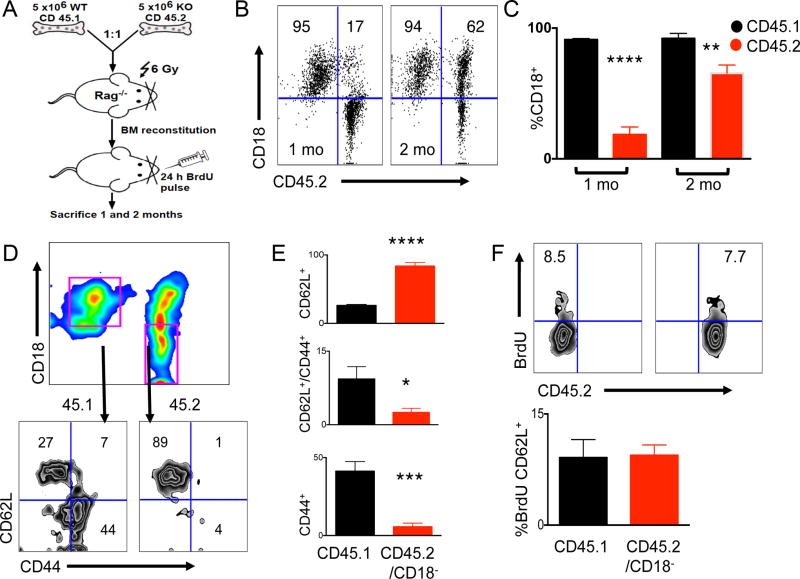
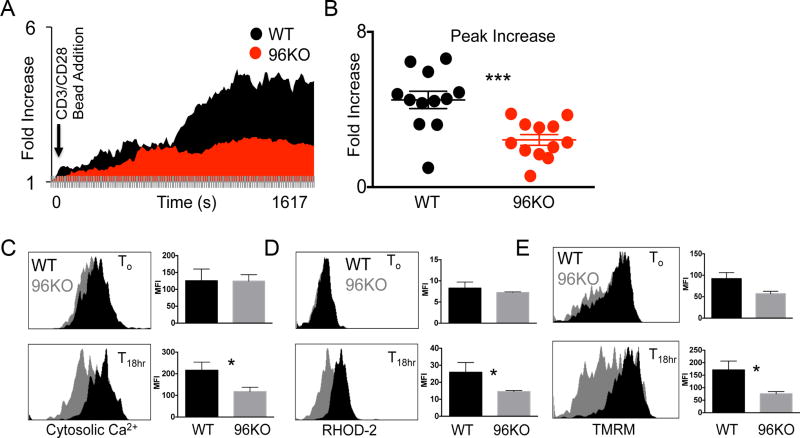
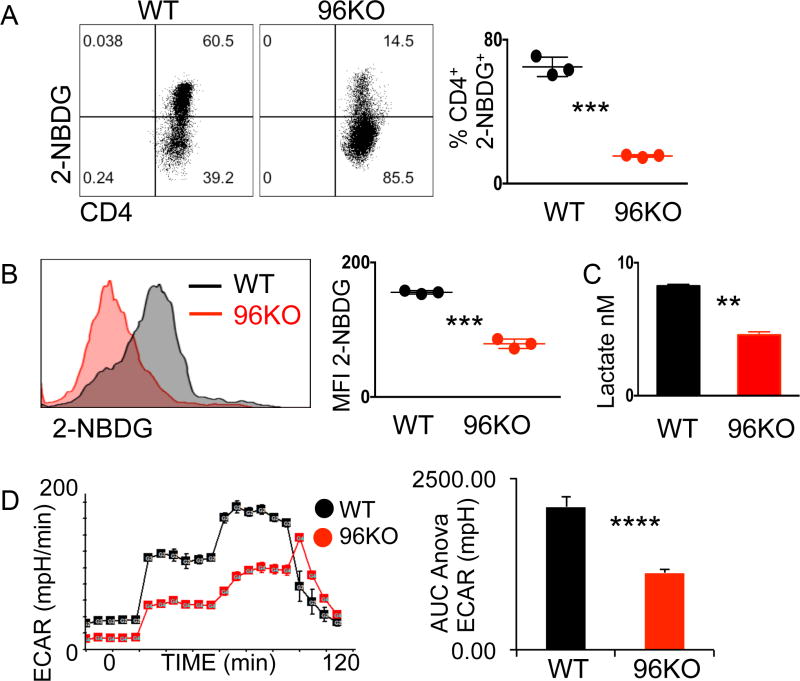
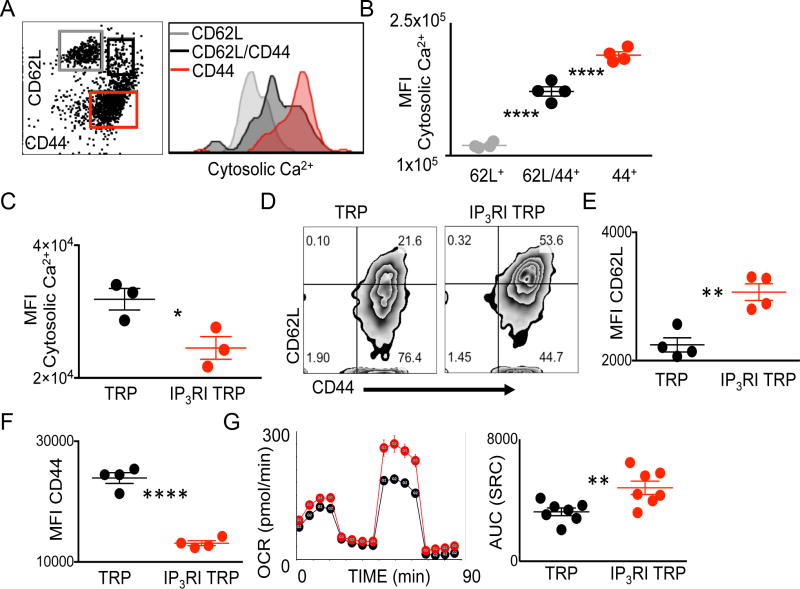
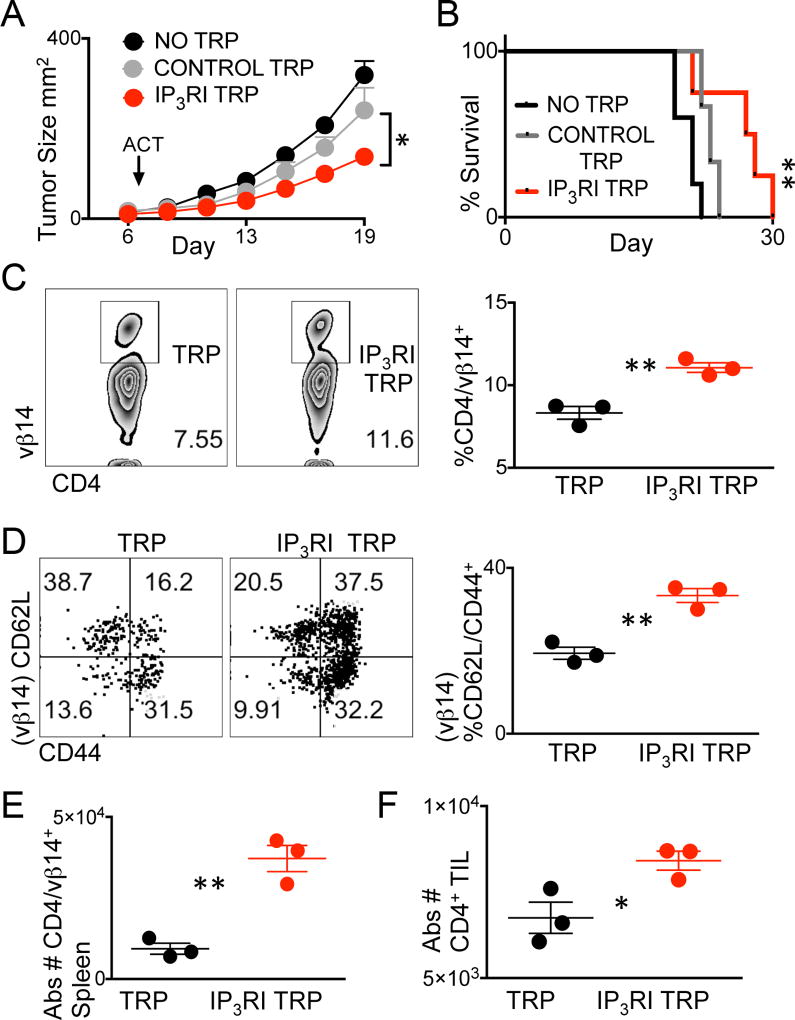
The endoplasmic reticulum (ER) is an energy-sensing organelle with intimate ties to programming cell activation and metabolic fate. T-cell receptor (TCR) activation represents a form of acute cell stress and induces mobilization of ER Ca2+ stores. The role of the ER in programming T-cell activation and metabolic fate remains largely undefined. Gp96 is an ER protein with functions as a molecular chaperone and Ca2+ buffering protein. We hypothesized that the ER stress response may be important for CD4+ T-cell activation and that gp96 may be integral to this process. To test our hypothesis, we utilized genetic deletion of the gp96 gene Hsp90b1 in a CD4+ T cell-specific manner. We show that gp96-deficient CD4+ T cells cannot undergo activation-induced glycolysis due to defective Ca2+ mobilization upon TCR engagement. We found that activating naïve CD4+ T cells while inhibiting ER Ca2+ exchange, through pharmacological blockade of the ER Ca2+ channel inositol trisphosphate receptor (IP3R), led to a reduction in cytosolic Ca2+ content and generated a pool of CD62Lhigh/CD44low CD4+ T cells compared with wild-type (WT) matched controls. In vivo IP3R-inhibited CD4+ T cells exhibited elevated tumor control above WT T cells. Together, these data show that ER-modulated cytosolic Ca2+ plays a role in defining CD4+ T-cell phenotype and function. Factors associated with the ER stress response are suitable targets for T cell-based immunotherapies. Cancer Immunol Res; 5(8); 666-75. ©2017 AACR.


Conflict of interest statement

Conflicts of Interest Statement: The authors declare no potential conflicts of interest.

Figures

Figure 1
Figure 1. ER stress chaperone gp96 is upregulated in response to TCR stimulation
(A) Quantitative RT-PCR analysis of gp96 expression in naive CD4+ or (B) CD8+ T cells isolated from WT spleens stimulated with CD3/28 for 0, 6, or 18 hours. (C) Representative flow cytometry histogram and quantification of intracellular staining for gp96 in CD4+ (top panel) or CD8+ (bottom panel) T cells 0 or 18 h post CD3/28 stimulation. Isotype controls shaded in gray. Representative flow cytometry plots and quantification of intracellular gp96 levels in (D) CD4+ T cells from TRP TCR transgenic mice or (E) CD8+ T cells from OT-1 TCR transgenic mice at To or 18 h after peptide activation. Data points represent separate mice. Data are mean ± SEM. Numbers in (D) and (E) represent percentage of cell in each quadrant. *P <0.05, **P <0.01, ***P < 0.001, ****P <0.0001, 2-tailed Student t test. Three independent repeats were performed for each experiment.
Figure 2
Figure 2. Gp96 T cell specific gene deletion induces CD4+ subset changes
(A) Representative histograms of gp96 expression in CD4+ or CD8+ single-positive thymocytes, splenocytes, or mesenteric lymph node (MLN) T cells preparations from CD4creHsp90b1flox/WT (WT) or CD4creHsp90b1flox/flox (96KO) mice. (B) Representative FACS plots for CD4+/8+ populations from WT or 96KO mice from thymus, spleen, or MLNs and (C) quantification of populations. (D) Representative FACS plots gated from CD4+/CD25 populations from WT or 96KO splenocytes and (E) percentage or (F) absolute number quantification of splenic subpopulations. Data are mean ± SD of 5–7 mice per group. *P < 0.05, **P < 0.01,****P < 0.000,1 2-tailed Student t test.
Figure 3
Figure 3. WT CD4+ T cells outcompete 96KO CD4+ T cells, indicative of a cell intrinsic defect
(A) Experimental design of 1:1 WT (CD45.1) or 96KO (CD45.2) T-cell depleted mixed bone marrow chimeras (BMC) transferred to irradiated (10Gy) Rag1−/− mice and harvested 1 and 2 months post transfer. (B) Representative flow cytometry plots of splenocytes from 1 and 2 months post bone marrow reconstitution, gated on CD4+ T cells and probed for CD45.2+/CD18 as a measure of gp96 deletion. (C) Quantification of CD4+ T cells probed for CD45.1/CD45.2/CD18 1 and 2 months post BMC reconstitution. (D) Representative flow cytometry plots of splenocytes from 2 months post BMC reconstitution, gated on CD4+ T cells and further gated from (pink gates) CD45.1/CD18+ (WT) or CD45.2/CD18 (96KO) populations assessed for CD62L/CD44 expression and (E) quantification of subset populations. (F) Representative flow cytometry plots of BrdU uptake gated from CD4+ splenic T cells from 24 hour pulsed 1 month BMC mice and (G) quantification of BrdU uptake in CD4/CD62L+ T cells gated from WT (CD45.1/CD18+) or 96KO (CD45.2/CD18) populations. Data are mean ± SD of 4 mice per group. *P < 0.05, **P < 0.01, ***P < 0.001, ****P < 0.0001, 2-tailed Student t test. Two independent repeats were performed for these experiments.
Figure 4
Figure 4. Gp96 is necessary for naïve CD4+ T-cell mobilization of intracellular Ca2+
(A) Real time single cell imaging in WT or 96KO CD4+/CD62L+ T cells. Naïve T cells were isolated and labeled with Fluo-2 (FITC) and CD4 (APC) and adhered to glass slide incubating chambers. At time 0 CD3/28 beads were added to media. Data are plotted as average fold increase in Fluo-4 for 12–16 cells per group over 11 second intervals for ~30 minutes. Analysis was performed with Image J software. (B) Peak fluorescent increase in Fluo-4 was recorded. Data are mean ± SEM of 12 cells per group. ***P < 0.0001, 2-tailed Student t test. Similar data were obtained for 4 mice per group in 4 separate experiments. Representative histograms and quantification from 0 or 18 hour CD3/28 activated splenocytes from WT or 96KO mice gated on CD4+/CD18+ (WT) or CD4+/CD18 (96KO) cells and probed for (C) cytosolic Ca2+ with Fluo-4 (D) mitochondrial Ca2+ with Rhod-2 (D) or mitochondrial membrane potential with TMRM. Data are means from 3 mice, three independent experimental repeats were performed. *P < 0.05, 2-tailed Student t test.
Figure 5
Figure 5. 96KO CD4+ T cells show impaired glucose uptake
(A) Representative flow cytometry plots or (B) histograms and quantification of 2-NBDG in vivo and in vitro uptake, respectively, by WT or 96KO CD4+ T cells. (C) Lactate secretion to media by WT or 96KO naïve CD4+ T cells cultured for 16 h post CD3/28 activation. Data are mean ± SEM of 3 mice per group, two independent experimental repeats were performed. **P <0.001, ***P <0.0001, 2-tailed Student’s t test. (D) Extracellular acidification (ECAR) rates in response to glucose, oligomycin, and 2-deoxyglucose additions to 16 hour CD3/28 activated WT or 96KO naïve CD4+ T cells. **P <0.001, Area under the curve ANOVA of rates 6–11. Four independent experimental repeats were performed.
Figure 6
Figure 6. Cell Ca2+ differentiates CD4+ T-cell lineages and modulation of lP3R promotes CD4+ T CD62Lhigh/CD44low phenotype
(A) Representative flow cytometry plots and (B) quantification of WT CD4+ gated splenocytes differentiated by CD62L/CD44 and probed for cytosolic Ca2+. Data are means from 4 mice, three independent experimental repeats were performed. ****P < 0.0001, 2-tailed Student t test. (C) Quantification of cytosolic Ca2+ content in 18 hour ex vivo peptide expanded TCR transgenic TRP T cells activated in the presence of IP3R inhibitor (IP3RI) 2-APB or vehicle control. (D) Representative flow cytometry plots and quantification of (E) CD62L MFI (F) CD44 MFI of day 7 ex vivo expanded TCR transgenic TRP T cells activated in the presence of IP3RI or vehicle control. (G) Oxygen consumption rates (OCR) and quantification of rates in response to addition of oligomycin, FCCP, and Rotenone/Antimycin A. (C,E-F) Data are mean ± SEM of individual mice and experiments were repeated at least twice, *P < 0.05, **P <0.001,****P < 0.0001, 2-tailed Student t test. (G) Data are mean ± SEM of pooled T cells from 5–7 mice per group, experiment was repeated 3 times, *P < 0.05, Area under the curve ANOVA of rate data, 8–13.
Figure 7
Figure 7. Modulation of cell Ca2+ enhances therapeutic efficacy of tumor-specific T Cells
Day 7 established B16F10 tumors were treated with no T cells, or 2 × 10⁶ TRP T cells cultured in the presence of IP3R inhibitor 2-APB (IP3R TRP) or vehicle control. (A) Tumor growth and (B) survival were measured. Survival endpoints were considered tumor size ≥ 400mm2 with n = 5 mice per group. Experiment was repeated twice. (A) *P < 0.05, 2-tailed Student t test of Control TRP versus IP3RI TRP and (B) **P < 0.001, Log-rank test. (C) Representative flow cytometry plots and quantification of CD4/Vβ14+ splenocytes or (D) CD62L/CD44 phenotype of CD4+/Vβ14+ splenocytes,5 days post adoptive cell therapy. (E) Absolute numbers of CD4+/Vβ14+ T cells in spleens or of (F) CD4+ T cell in tumors 5 days post ACT. (C–F) Data points represent 3 mice per group, *P < 0.05, **P < 0.01 2-tailed Student t test.

Similar articles

Cited by

References

    1. Williams MA, Bevan MJ. Effector and memory CTL differentiation. Annual review of immunology. 2007;25:171–92. doi: 10.1146/annurev.immunol.25.022106.141548. - DOI - PubMed
    1. Buck MD, O'Sullivan D, Pearce EL. T cell metabolism drives immunity. The Journal of experimental medicine. 2015;212(9):1345–60. doi: 10.1084/jem.20151159. - DOI - PMC - PubMed
    1. Feske S. Calcium signalling in lymphocyte activation and disease. Nature reviews Immunology. 2007;7(9):690–702. doi: 10.1038/nri2152. - DOI - PubMed
    1. Le Borgne M, Raju S. Real-Time Analysis of Calcium Signals during the Early Phase of T Cell Activation Using a Genetically Encoded Calcium Biosensor. 2016;196(4):1471–9. doi: 10.4049/jimmunol.1502414. - DOI - PMC - PubMed
    1. Weber KS, Hildner K, Murphy KM, Allen PM. Trpm4 differentially regulates Th1 and Th2 function by altering calcium signaling and NFAT localization. Journal of immunology (Baltimore, Md : 1950) 2010;185(5):2836–46. doi: 10.4049/jimmunol.1000880. - DOI - PMC - PubMed

Publication types

MeSH terms