Multicenter Study
. 2017 Aug;38(8):1501-1509.
doi: 10.3174/ajnr.A5254. Epub 2017 Jun 22.

Volumetric Analysis from a Harmonized Multisite Brain MRI Study of a Single Subject with Multiple Sclerosis

Affiliations
Multicenter Study

Volumetric Analysis from a Harmonized Multisite Brain MRI Study of a Single Subject with Multiple Sclerosis

R T Shinohara et al. AJNR Am J Neuroradiol. 2017 Aug.

Abstract

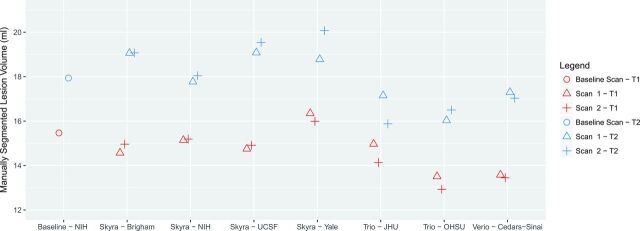
Background and purpose: MR imaging can be used to measure structural changes in the brains of individuals with multiple sclerosis and is essential for diagnosis, longitudinal monitoring, and therapy evaluation. The North American Imaging in Multiple Sclerosis Cooperative steering committee developed a uniform high-resolution 3T MR imaging protocol relevant to the quantification of cerebral lesions and atrophy and implemented it at 7 sites across the United States. To assess intersite variability in scan data, we imaged a volunteer with relapsing-remitting MS with a scan-rescan at each site.

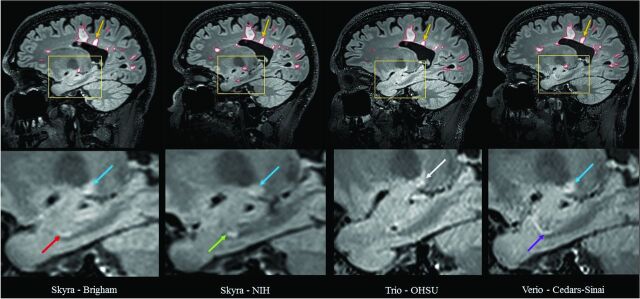
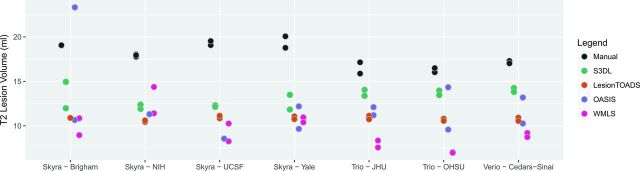
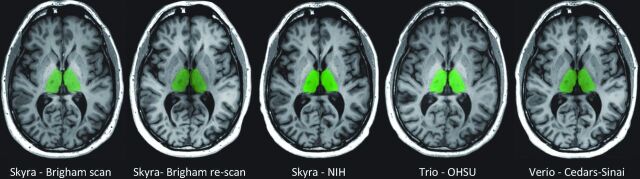
Materials and methods: All imaging was acquired on Siemens scanners (4 Skyra, 2 Tim Trio, and 1 Verio). Expert segmentations were manually obtained for T1-hypointense and T2 (FLAIR) hyperintense lesions. Several automated lesion-detection and whole-brain, cortical, and deep gray matter volumetric pipelines were applied. Statistical analyses were conducted to assess variability across sites, as well as systematic biases in the volumetric measurements that were site-related.

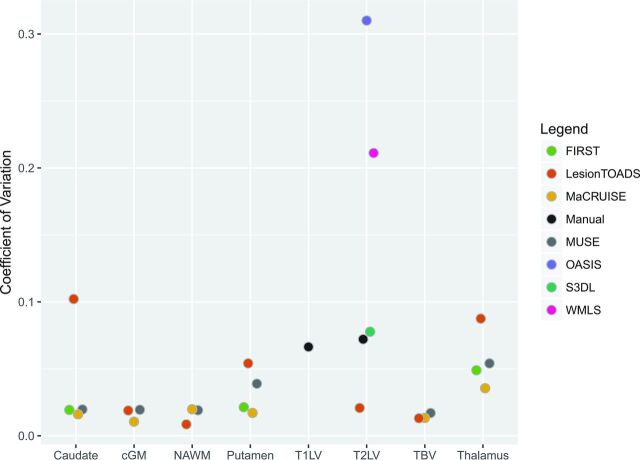
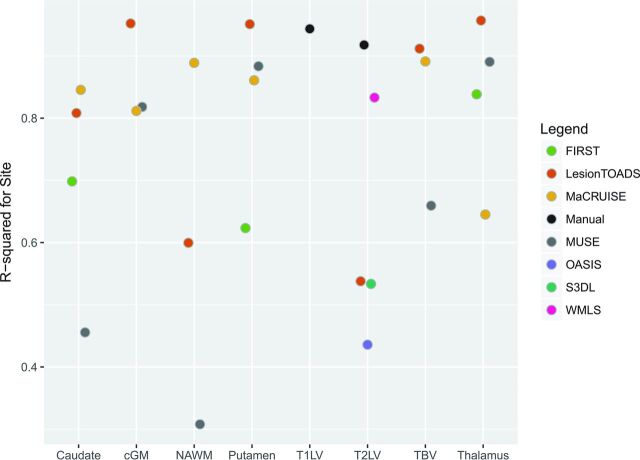
Results: Systematic biases due to site differences in expert-traced lesion measurements were significant (P < .01 for both T1 and T2 lesion volumes), with site explaining >90% of the variation (range, 13.0-16.4 mL in T1 and 15.9-20.1 mL in T2) in lesion volumes. Site also explained >80% of the variation in most automated volumetric measurements. Output measures clustered according to scanner models, with similar results from the Skyra versus the other 2 units.

Conclusions: Even in multicenter studies with consistent scanner field strength and manufacturer after protocol harmonization, systematic differences can lead to severe biases in volumetric analyses.


Figures

Fig 1.
Fig 1.
Manually measured T1 (red) and T2 (blue) lesion volumes for scan-rescan pairs at each of 7 NAIMS sites. Results from the baseline scan, acquired on the same Skyra scanner and subsequent imaging acquired at the National Institutes of Health, are shown with circles. Points have been slightly offset relative to one another for ease of visualization. UCSF indicates University of California, San Francisco; JHU, Johns Hopkins University; OHSU, Oregon Health & Science University.
Fig 2.
Fig 2.
Comparison of manual segmentation of cerebral T2 hyperintense lesions at 4 NAIMS sites. 3T MR imaging scans on Siemens scanners from a single subject with multiple sclerosis showing T2 hyperintense lesions from sagittal fluid-attenuated inversion recovery sequences from 4 different North American Imaging in Multiple Sclerosis Cooperative sites and scanner models: Brigham and Women's Hospital, Skyra; National Institutes of Health, Skyra; Oregon Health & Science University (OHSU), Tim Trio; Cedars-Sinai, Verio. The upper panel shows the native images. The lower panel shows zoomed and cropped images to illustrate the key findings. The green arrow (lower panel) shows a possible lesion detected and traced on the National Institutes of Health scan; the red arrow shows the same lesion not detected by the expert procedure on the Brigham and Women's Hospital scan. The purple arrow shows a similar tubular area interpreted as a blood vessel on the Cedars-Sinai scan, which was not selected as a lesion by the expert tracing; no lesion was detected on the Oregon Health & Science University scan in this area on this section or any of the adjacent sections (not shown). The blue arrow shows a different lesion detected and traced on the Brigham and Women's Hospital, National Institutes of Health, and Cedars-Sinai scans but not detected by the expert review on the Oregon Health & Science University scan, appearing hazy/subtle (white arrow). The yellow arrow (upper panel) shows a lesion on all scans; however, when we added the tracing of all sections showing the lesion, the 3D volume of the lesion differed among sites: Brigham and Women's Hospital = 0.059 mL, National Institutes of Health = 0.053 mL, Oregon Health & Science University = 0.033 mL, Cedars-Sinai = 0.053 mL.
Fig 3.
Fig 3.
Comparison of manual and automated methods for measuring lesional volume. Scan-rescan imaging is shown by using multiple dots for each site and algorithm. UCSF indicates University of California, San Francisco; JHU, Johns Hopkins University; OHSU, Oregon Health & Science University.
Fig 4.
Fig 4.
FSL-FIRST automated segmentation results: thalamus. Representative anatomic section showing segmentation of the thalamus (green) in the single subject. The segmentation maps are overlaid to the original raw 3D T1-weighted images after re-orientation to the axial plane. Segmentation was performed by the fully automated FSL-FIRST pipeline. The scan site and 3T Siemens model are shown for each image. The first 2 scans are from the scan/re-scan at Brigham and Women's Hospital. OHSU indicates Oregon Health & Science University.
Fig 5.
Fig 5.
Comparison of automated methods for measuring thalamic volume. Scan-rescan imaging is shown by using multiple dots for each site and algorithm. UCSF indicates University of California, San Francisco; JHU, Johns Hopkins University; OHSU, Oregon Health & Science University.
Fig 6.
Fig 6.
Estimated across-site coefficient of variation for each structure with various methods for volumetric measurement. cGM indicates cortical gray matter; NAWM, normal-appearing white matter; TBV, total brain volume.
Fig 7.
Fig 7.
Estimated proportion of variation explained by site for using various segmentation methods for different structures in the brain. cGM indicates cortical gray matter; NAWM, normal-appearing white matter; TBV, total brain volume.
Fig 8.
Fig 8.
Negative logarithm (base 10) P value from t tests describing the difference in average volume between Skyra-versus-non-Skyra platforms explained by site with various segmentation methods for different structures in the brain. cGM indicates cortical gray matter; NAWM, normal-appearing white matter; TBV, total brain volume.

References

    1. García-Lorenzo D, Francis S, Narayanan S, et al. . Review of automatic segmentation methods of multiple sclerosis white matter lesions on conventional magnetic resonance imaging. Med Image Anal 2013;17:1–18 10.1016/j.media.2012.09.004 - DOI - PubMed
    1. Lublin FD, Reingold SC, Cohen JA, et al. . Defining the clinical course of multiple sclerosis: the 2013 revisions. Neurology 2014;83:278–86 10.1212/WNL.0000000000000560 - DOI - PMC - PubMed
    1. Simon JH, Jacobs LD, Campion M, et al. . Magnetic resonance studies of intramuscular interferon beta-1a for relapsing multiple sclerosis: the Multiple Sclerosis Collaborative Research Group. Ann Neurol 1998;43:79–87 10.1002/ana.410430114 - DOI - PubMed
    1. Bagnato F, Jeffries N, Richert ND, et al. . Evolution of T1 black holes in patients with multiple sclerosis imaged monthly for 4 years. Brain 2003;126(pt 8):1782–89 10.1093/brain/awg182 - DOI - PubMed
    1. Sahraian MA, Radue EW, Haller S, et al. . Black holes in multiple sclerosis: definition, evolution, and clinical correlations. Acta Neurol Scand 2010;122:1–8 10.1111/j.1600-0404.2009.01221.x - DOI - PubMed

Publication types