. 2017 Jun 22;7(1):4052.
doi: 10.1038/s41598-017-04246-y.

Regulation of glycolysis in brown adipocytes by HIF-1α

Affiliations

Regulation of glycolysis in brown adipocytes by HIF-1α

Astrid L Basse et al. Sci Rep. .

Abstract

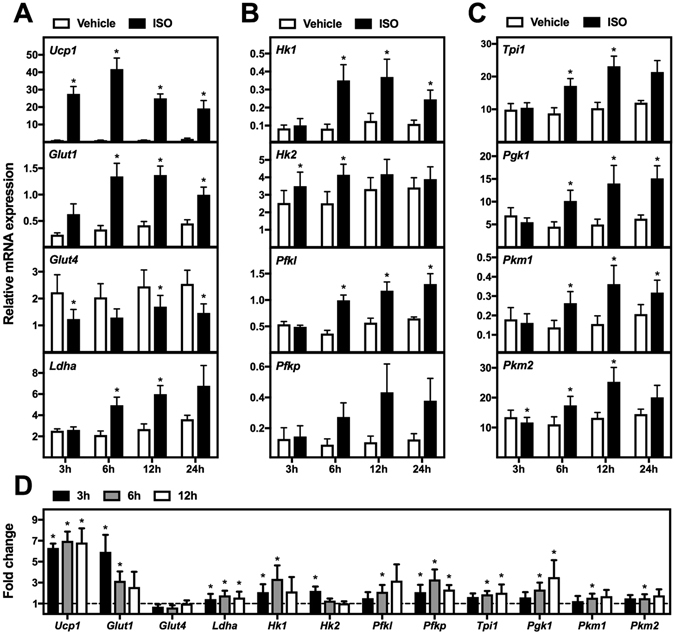
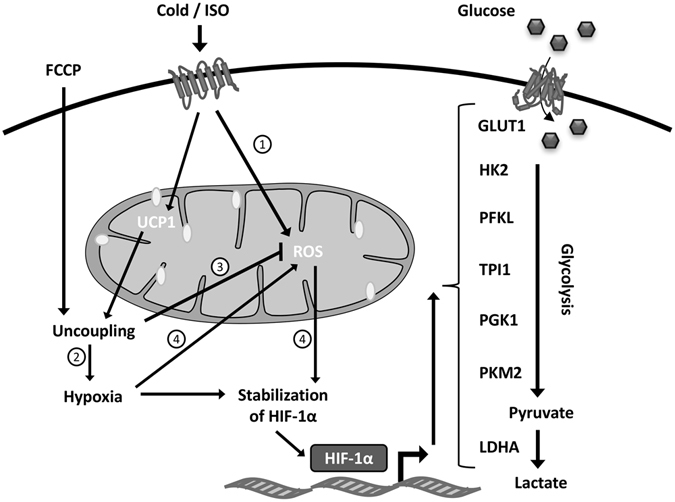
Brown adipose tissue takes up large amounts of glucose during cold exposure in mice and humans. Here we report an induction of glucose transporter 1 expression and increased expression of several glycolytic enzymes in brown adipose tissue from cold-exposed mice. Accordingly, these genes were also induced after β-adrenergic activation of cultured brown adipocytes, concomitant with accumulation of hypoxia inducible factor-1α (HIF-1α) protein levels. HIF-1α accumulation was dependent on uncoupling protein 1 and generation of mitochondrial reactive oxygen species. Expression of key glycolytic enzymes was reduced after knockdown of HIF-1α in mature brown adipocytes. Glucose consumption, lactate export and glycolytic capacity were reduced in brown adipocytes depleted of Hif-1α. Finally, we observed a decreased β-adrenergically induced oxygen consumption in Hif-1α knockdown adipocytes cultured in medium with glucose as the only exogenously added fuel. These data suggest that HIF-1α-dependent regulation of glycolysis is necessary for maximum glucose metabolism in brown adipocytes.


Conflict of interest statement

The authors declare that they have no competing interests.

Figures

Figure 1
Figure 1
Expression levels of genes associated with glycolysis in iBAT, iWAT and eWAT of mice exposed to cold or thermoneutrality. Total RNA was isolated from iBAT, iWAT and eWAT of control mice kept at room temperature (RT, white bars) (n = 12), mice kept at thermoneutrality for 8 days (TN, black bars) (n = 6) and mice exposed to cold for 3 h, 6 h, 12 h, 24 h, 2 d, 4 d or 8 d (grey bars) (n = 6). Relative gene expression was measured in iBAT by RT-qPCR for: (A) Ucp1, Glut1, Glut4 and Ldha; (B) Hk1, Hk2, Pfkl and Pfkp; (C) Tpi1, Pgk1, Pkm1 and Pkm2. (D) Mass (g) of iBAT and iBAT mass as percent of body weight. (E) Fold change in gene expression level in iWAT and (F) eWAT. The mRNA expression levels were normalized to TATA-binding protein (Tbp). Data represents mean + SEM. *p < 0.05 versus RT.
Figure 2
Figure 2
Expression levels of genes associated with glycolysis in brown adipocytes after β-adrenergic stimulation in vitro. (A–C) Mature brown adipocytes (WT-1) were treated with vehicle (white bars) or 0.1 μM isoproterenol (ISO, black bars) for 3, 6, 12 or 24 h. Total RNA was harvested and analyzed by RT-qPCR (n = 4). Relative gene expression was measured for: (A) Ucp1, Glut1, Glut4 and Ldha; (B) Hk1, Hk2, Pfkl and Pfkp; (C) Tpi1, Pgk1, Pkm1 and Pkm2. (D) Mature primary brown adipocytes were treated with vehicle or 0.1 μM isoproterenol for 3 h (black bars), 6 h (grey bars) or 12 h (white bars). Relative gene expression was measured and presented as fold change relative to the corresponding vehicle-treated samples (n = 4). mRNA expression levels were normalized to Tbp. Data represent mean of means + SEM. *p < 0.05 versus vehicle controls.
Figure 3
Figure 3
Expression levels of genes associated with glycolysis during chemical uncoupling or hypoxia. (A) Total RNA was isolated from mature brown adipocytes (WT-1) treated with vehicle, 0.1 μM isoproterenol (ISO) (black bars) or 1 μM of the chemical uncoupler FCCP (white bars) for 12 h. Relative gene expression was analyzed by RT-qPCR (n = 4) and presented as fold change relative to the corresponding vehicle-treated samples. (B) Representative fold induction in oxygen consumption rate (OCR) 30 min after stimulation of WT-1 brown adipocytes with 0.1 μM ISO (black bar) or 1 μM FCCP (white bar) on a Seahorse XF96 Flux Analyzer (n = 3) (C) Total RNA was isolated from mature brown adipocytes (WT-1) treated with vehicle or 0.1 μM ISO (black bars) or exposed to hypoxia (1% O2) (white bars) for 12 h. Relative gene expression was analyzed by RT-qPCR (n = 5) and presented as fold change relative to the corresponding control samples. (D) Total RNA was isolated from mature brown adipocytes (WT-1), which were reverse transfected with scramble siRNA or siRNA against Hif-1α at day 6 after initiation of differentiation. Mature cells at day 10 were exposed to normoxia or hypoxia (1% O2) for 12 h. Relative gene expression was analyzed by RT-qPCR (n = 3) and presented as fold change relative to the corresponding normoxia control samples. (E) Immunoblotting analyses of HIF-1α in brown WT-1 adipocytes transfected with scramble siRNA or siRNA against Hif-1α. The mRNA expression levels were normalized to Tbp. Gene expression data represent mean of means + SEM. *p < 0.05 versus vehicle control. #p < 0.05 versus ISO stimulated cells (panel A and C) or scramble siRNA transfected cells (panel D). Transcription factor II B (TFIIB) was used as loading control in panel E. Full-length blots for panel E are shown in Supplementary Figure S1.
Figure 4
Figure 4
Hif-1α mRNA and HIF-1α protein levels. (A) Total RNA was isolated from mature brown adipocytes (WT-1). Relative mRNA expression was measured by RT-qPCR for Hif-1α in cells treated with vehicle (white bars) or 0.1 μM ISO (black bars) for 3, 6, 12 or 24 h (n = 4). (B) Total RNA was isolated from primary mature brown adipocytes. Relative mRNA expression was measured by RT-qPCR for Hif-1α in cells treated with vehicle (white bars) or 0.1 μM ISO (black bars) for 3, 6 or 12 h (n = 4). Immunoblotting analysis of HIF-1α in (C) WT-1 brown adipocytes and in (D) primary brown adipocytes stimulated with vehicle or ISO for 1, 3, 6 and 12 h. (E) Immunoblotting analysis of HIF-1α in human brown adipocytes stimulated with vehicle or ISO for 3 or 6 h. (F) Relative gene expression for Hif-1α (n = 4) and (G) immunoblotting analyses of HIF-1α were performed on mature brown adipocytes (WT-1) treated with vehicle, 0.1 μM ISO or 1 μM FCCP for 12 h (gene expression) or 4 h (immunoblotting). (H) Relative gene expression for Hif-1α (n = 4) and (I) immunoblotting analysis of HIF-1α were performed on mature brown adipocytes (WT-1) treated with vehicle, 0.1 μM ISO or exposed to hypoxia (1% O2) for 12 h (gene expression) or 3 h (immunoblotting). (J) Immunoblotting analysis for HIF-1α and UCP1 was performed on mature brown adipocytes (WT-1) or (K) in mature primary brown adipocytes, which were reverse transfected with a scramble siRNA or siRNAs against Hif-1α at day 6 after initiation of differentiation or 8 days after isolation, respectively. Four days later, the adipocytes were stimulated with vehicle or 0.1 μM ISO for 3 h. mRNA levels were normalized to Tbp. (L) Immunoblotting analysis for HIF-1α was performed on mature brown adipocytes (WT-1), which were pretreated or not with 5 μM MitoQ for 1 h, followed by stimulation with vehicle or 0.1 μM ISO for an additional 3 h. Data represent mean of means + SEM. *p < 0.05 versus vehicle (panel A, B, F and H). TFIIB was used as loading control for immunoblotting (panel C–E, G and I–L). Full-length blots for panels C–E, G and I–L are shown in Supplementary Figure S1.
Figure 5
Figure 5
Involvement of HIF-1α in regulation of expression of genes associated with glycolysis in a brown adipocyte cell line. Mature brown adipocytes (WT-1) were reverse transfected with two different siRNAs against Hif-1α at day 6 after initiation of differentiation. Mature cells at day 10 were treated with vehicle (white bars) or 0.1 μM ISO (black bars) for 12 h. Total RNA was harvested and analyzed by RT-qPCR (n = 3). Relative gene expression was measured for: (A) Hif-1α; (C) Ucp1, Glut1, Glut4 and Ldha; (D) Hk1, Hk2, Pfkl and Pfkp; (E) Tpi1, Pgk1, Pkm1 and Pkm2. mRNA expression levels were normalized to Tbp. Data represent mean of means + SEM. *p < 0.05 versus vehicle-treated cells transfected with the same siRNA. #p < 0.05 versus scramble siRNA transfected cells treated in the same way (vehicle or ISO). (B) Immunoblotting analysis of HIF-1α in brown adipocytes (WT-1) reverse transfected with scramble siRNA or two different siRNAs against Hif-1α. Four days after the transfection, adipocytes were treated with vehicle or 0.1 μM ISO for 3 h. TFIIB was used as loading control. Full-length blots for panel B are shown in Supplementary Figure S1.
Figure 6
Figure 6
Involvement of HIF-1α in regulation of expression of genes associated with glycolysis in primary brown adipocytes. Primary mature brown adipocytes were reverse transfected with scramble siRNA or two different siRNAs against Hif-1α at day 8 after isolation. Four days later the primary adipocytes were treated with vehicle (white bars) or 0.1 μM ISO (black bars) for 12 h. Total RNA was harvested and analyzed by RT-qPCR (n = 4). Relative gene expression was measured for: (A) Hif-1α; (C) Ucp1, Glut1, Glut4, and Ldha; (D) Hk1, Hk2, Pfkl and Pfkp; (E) Tpi1, Pgk1, Pkm1 and Pkm2. The mRNA expression levels were normalized to Tbp. Data represent mean of means + SEM. *p < 0.05 versus vehicle-treated cells transfected with the same siRNA. #p < 0.05 versus scramble siRNA transfected cells treated in the same way (vehicle or ISO). (B) Immunoblotting analysis of HIF-1α in primary brown adipocytes transfected with scramble siRNA or two different siRNAs against Hif-1α. Four days after transfection, adipocytes were treated with vehicle or 0.1 μM ISO for 3 h. TFIIB was used as loading control. Full-length blots for panel B are shown in Supplementary Figure S1.
Figure 7
Figure 7
The importance of HIF-1α for β-adrenergically stimulated glycolysis and thermogenesis. Mature brown adipocytes (WT-1) were reverse transfected with scramble siRNA or two different siRNAs against Hif-1α. Four days later, the adipocytes were stimulated with vehicle or 1 μM ISO for 6 h, after which glucose (A) and lactate (B) measurements were performed on the medium. (C) Representative results from Seahorse XF Glycolysis Stress Tests performed on mature adipocytes (WT-1), which were reverse transfected with scramble siRNA or an siRNA against Hif-1α (siRNA 1) (n = 3). (D–G) Extracellular acidification rate (ECAR) and oxygen consumption rate (OCR) were measured four days after transfection (n = 5). (D) Representative time-course of ECAR during basal conditions and after injection of 1 μM ISO. (E) Fold change in ECAR between the basal level and the measurement 30 min after ISO stimulation. (F) Representative time-course of OCR during basal conditions and after injection of 1 μM ISO. (G) Fold change in OCR between the basal level and the measurement 30 min after ISO stimulation. (H–K) ECAR and OCR were measured at day 8 on a Seahorse XF96 Flux Analyzer after treatment with 5 μM MitoQ or vehicle (n = 4). (H) Representative time-course of ECAR during basal conditions and after injection of 1 μM ISO. (I) Fold change in ECAR between the basal level and the measurement 30 min after ISO stimulation. (J) Representative time-course of OCR during basal conditions and after injection of 1 μM ISO. (K) Fold change in OCR between the basal level and the measurement 30 min after ISO stimulation. (L) Total RNA was isolated from mature adipocytes (WT-1) transfected with scramble siRNA or two different siRNAs against Hif-1α. Relative gene expression was analyzed by RT-qPCR and presented as fold change relative to the scramble siRNA-transfected cells. The genes measured were Cyc1, CoxII, Cs, Pgc-1α and Tfam (n = 3). mRNA expression levels were normalized to Tbp. Data represent mean + SEM (panel C-K) or mean of means + SEM (panel A, B and L). *p < 0.05 versus vehicle-treated cells. #p < 0.05 versus scramble siRNA transfected cells.
Figure 8
Figure 8
A proposed model for HIF-1α-dependent regulation of glycolysis in brown adipocytes. Illustrated is a model of how cold and β-adrenergic stimulation cause HIF-1α stabilization in brown adipocytes through mitochondrial uncoupling and reactive oxygen species (ROS) production. HIF-1α in turn induces the expression of Glut1, Hk2, Pfkl, Tpi1, Pgk1, Pkm2 and Ldha, increasing glycolytic flux capacity. 1) β-Adrenergic stimulation induces the production of mitochondrial ROS in brown adipocytes. 2) Cold-stimulated mitochondrial uncoupling induces hypoxia in BAT. 3) FCCP-induced mitochondrial uncoupling decreases mitochondrial ROS production in brown adipocytes, . 4) Hypoxia-induced HIF-1α stabilization through increased mitochondrial ROS production.

References

    1. Cannon B, Nedergaard J. Brown adipose tissue: function and physiological significance. Physiological reviews. 2004;84:277–359. doi: 10.1152/physrev.00015.2003. - DOI - PubMed
    1. Kajimura S, Saito M. A new era in brown adipose tissue biology: molecular control of brown fat development and energy homeostasis. Annual review of physiology. 2014;76:225–249. doi: 10.1146/annurev-physiol-021113-170252. - DOI - PMC - PubMed
    1. Bartelt A, et al. Brown adipose tissue activity controls triglyceride clearance. Nature medicine. 2011;17:200–205. doi: 10.1038/nm.2297. - DOI - PubMed
    1. Orava J, et al. Different metabolic responses of human brown adipose tissue to activation by cold and insulin. Cell metabolism. 2011;14:272–279. doi: 10.1016/j.cmet.2011.06.012. - DOI - PubMed
    1. Dallner OS, Chernogubova E, Brolinson KA, Bengtsson T. Beta3-adrenergic receptors stimulate glucose uptake in brown adipocytes by two mechanisms independently of glucose transporter 4 translocation. Endocrinology. 2006;147:5730–5739. doi: 10.1210/en.2006-0242. - DOI - PubMed

Publication types

MeSH terms

Substances