. 2017 Jun 22;7(1):4077.
doi: 10.1038/s41598-017-04450-w.

3D Bayesian cluster analysis of super-resolution data reveals LAT recruitment to the T cell synapse

Affiliations

3D Bayesian cluster analysis of super-resolution data reveals LAT recruitment to the T cell synapse

Juliette Griffié et al. Sci Rep. .

Abstract

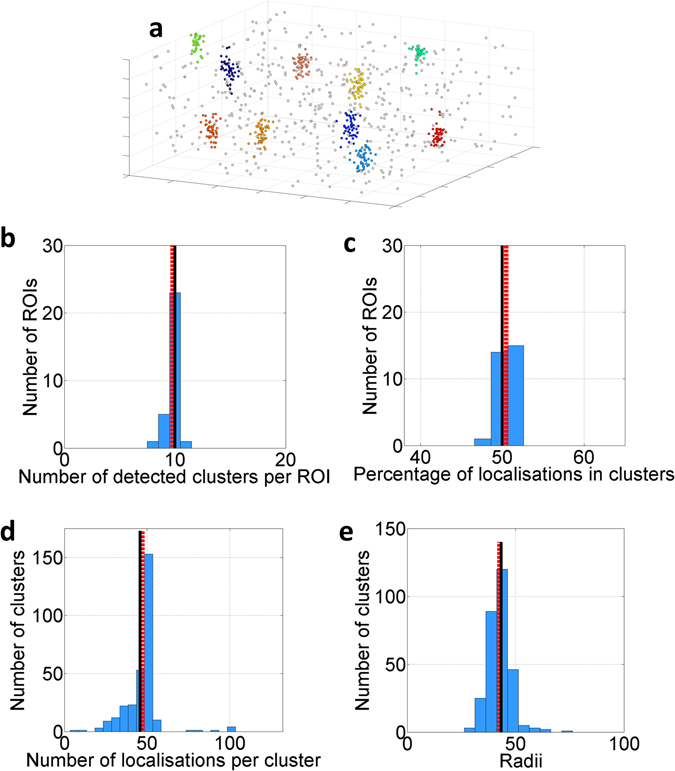
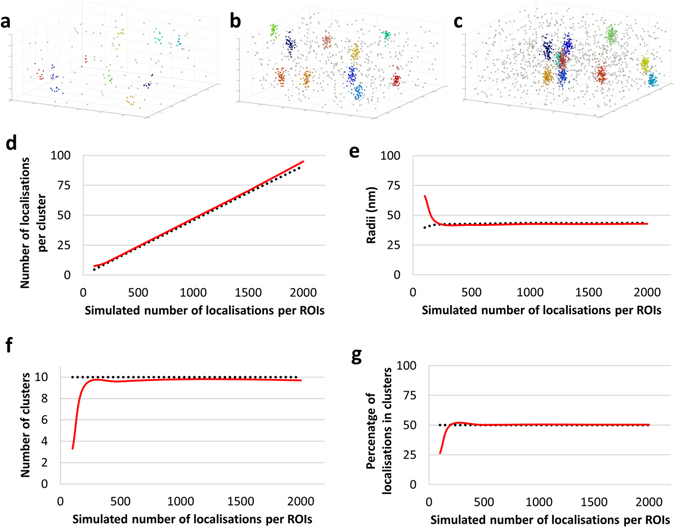
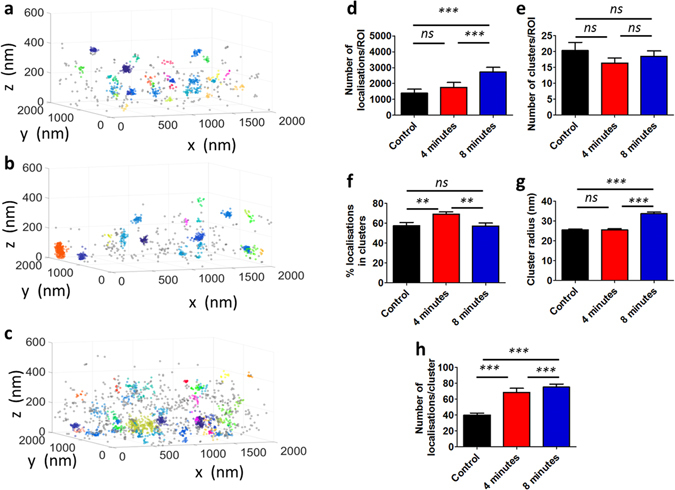
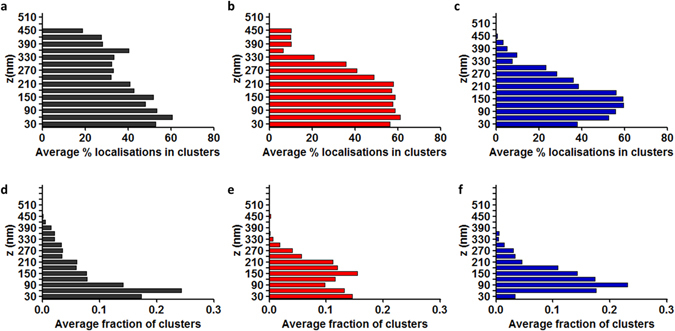
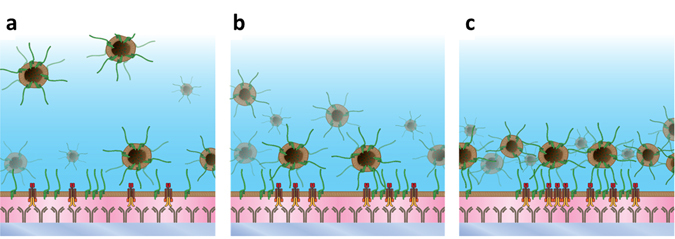
Single-molecule localisation microscopy (SMLM) allows the localisation of fluorophores with a precision of 10-30 nm, revealing the cell's nanoscale architecture at the molecular level. Recently, SMLM has been extended to 3D, providing a unique insight into cellular machinery. Although cluster analysis techniques have been developed for 2D SMLM data sets, few have been applied to 3D. This lack of quantification tools can be explained by the relative novelty of imaging techniques such as interferometric photo-activated localisation microscopy (iPALM). Also, existing methods that could be extended to 3D SMLM are usually subject to user defined analysis parameters, which remains a major drawback. Here, we present a new open source cluster analysis method for 3D SMLM data, free of user definable parameters, relying on a model-based Bayesian approach which takes full account of the individual localisation precisions in all three dimensions. The accuracy and reliability of the method is validated using simulated data sets. This tool is then deployed on novel experimental data as a proof of concept, illustrating the recruitment of LAT to the T-cell immunological synapse in data acquired by iPALM providing ~10 nm isotropic resolution.


Conflict of interest statement

The authors declare that they have no competing interests.

Figures

Figure 1
Figure 1
3D Bayesian cluster analysis of n = 30 simulated data sets in the Standard Condition. (a) Representative 3D cluster map with the simulated clusters depicted in colour and non-clustered localisations in grey. (b) Number of detected clusters per ROI, (c) percentage of localisations detected in clusters, (d) number of detected localisations per cluster and (e) cluster radii (nm). In each case (b–e), the simulated values (black solid line) and mean detected value (red dashed line) are presented.
Figure 2
Figure 2
Examining the effect of increasing total number of localisations in the ROI on the Bayesian cluster analysis of simulated data sets (n = 30 simulations) from 100 localisations per ROIs to 2000 localisations per ROIs, under the Standard Conditions. Representative cluster maps with (a) 200, (b) 1000 and (c) 2000 localisations within the 3000 × 3000 × 600 nm ROI. (d) Mean number of detected localisations per cluster as a function of the number of localisations per cluster, compared to the simulated (true) value, (e) mean cluster radii as a function of the number of localisations per cluster, compared to the simulated (true) value, (f) mean number of detected clusters per ROI as a function of the number of localisations per cluster, compared to the simulated value and (g) mean percentage of localisations detected in clusters as a function of the number of localisations per cluster, compared to the simulated value. Red = results of the analysis, black = simulated values.
Figure 3
Figure 3
3D Bayesian cluster analysis of iPALM data of the distribution of LAT at the T cell immunological synapse. Representative cluster maps of LAT-mEos3.2 (a) in non-activated T cells, (b) in T cell synapses fixed after 4 mins, (c) in T cell synapses fixed after 8 mins. For each condition, (d) total number of localisations per ROI, (e) number of detected clusters per ROI, (f) percentage of localisations in clusters for each ROI, (g) cluster radii and (h) number of localisations per cluster. Bars represent mean values and S.E.M. ns = not significant, *p ≤ 0.01, **p ≤ 0.001, ***p ≤ 0.0001, Mann-Whitney U Test.
Figure 4
Figure 4
Histograms of the z distribution of LAT at the T cell immunological synapse. (a) Average percentage of localisations in clusters at each z plane for the control condition. (b) Average percentage of localisations in clusters at each z plane for 4 minutes post-activation. (c) Average percentage of localisations in clusters at each z plane for 8 minutes post-activation. (d) Average fraction of number of clusters at each z position for the control condition. (e) Average fraction of number of clusters at each z position for 4 minutes post-activation. (f) Average fraction of number of clusters at each z position for 8 minutes post-activation. Histogram bins are 30 nm.
Figure 5
Figure 5
Model for LAT (green) recruitment following T cell activation through the TCR (yellow and red) pathway via antibodies (grey). (a) Control conditions showing LAT vesicles up to 500 nm in depth as well as pre-clustered LAT in the plasma membrane. (b) 4 minutes after activation showing the recruitment of LAT vesicles to the vicinity of the plasma membrane. (c) 8 minutes condition showing the accumulation of recruited vesicles proximal to the membrane forming a dense signalling platform.

References

    1. Betzig E, et al. Imaging Intracellular Fluorescent Proteins at Nanometer Resolution. Science. 2006;313:1642–1645. doi: 10.1126/science.1127344. - DOI - PubMed
    1. Hess ST, Girirajan TPK, Mason MD. Ultra-High Resolution Imaging by Fluorescence Photoactivation Localization Microscopy. Biophys. J. 2006;91:4258–4272. doi: 10.1529/biophysj.106.091116. - DOI - PMC - PubMed
    1. Rust MJ, Bates M, Zhuang X. Sub-diffraction-limit imaging by stochastic optical reconstruction microscopy (STORM) Nat. Meth. 2006;3:793–796. doi: 10.1038/nmeth929. - DOI - PMC - PubMed
    1. Heilemann M, et al. Subdiffraction-Resolution Fluorescence Imaging with Conventional Fluorescent Probes. Angew. Chem. Int. Ed. 2008;47:6172–6176. doi: 10.1002/anie.200802376. - DOI - PubMed
    1. Sage D, et al. Quantitative evaluation of software packages for single-molecule localization microscopy. Nat. Meth. 2015;12:717–724. doi: 10.1038/nmeth.3442. - DOI - PubMed

Publication types

Substances