. 2017 Jun 8:8:336.
doi: 10.3389/fphar.2017.00336. eCollection 2017.

Quercetin, a Lead Compound against Type 2 Diabetes Ameliorates Glucose Uptake via AMPK Pathway in Skeletal Muscle Cell Line

Affiliations

Quercetin, a Lead Compound against Type 2 Diabetes Ameliorates Glucose Uptake via AMPK Pathway in Skeletal Muscle Cell Line

R Dhanya et al. Front Pharmacol. .

Abstract

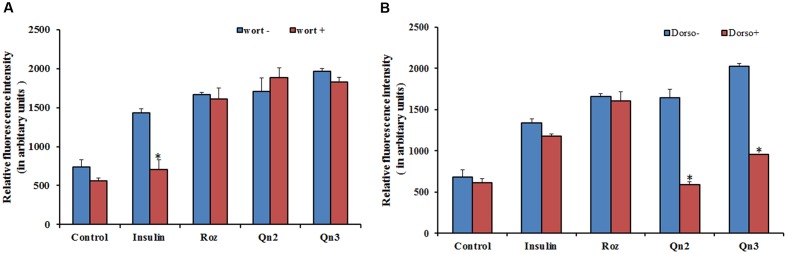
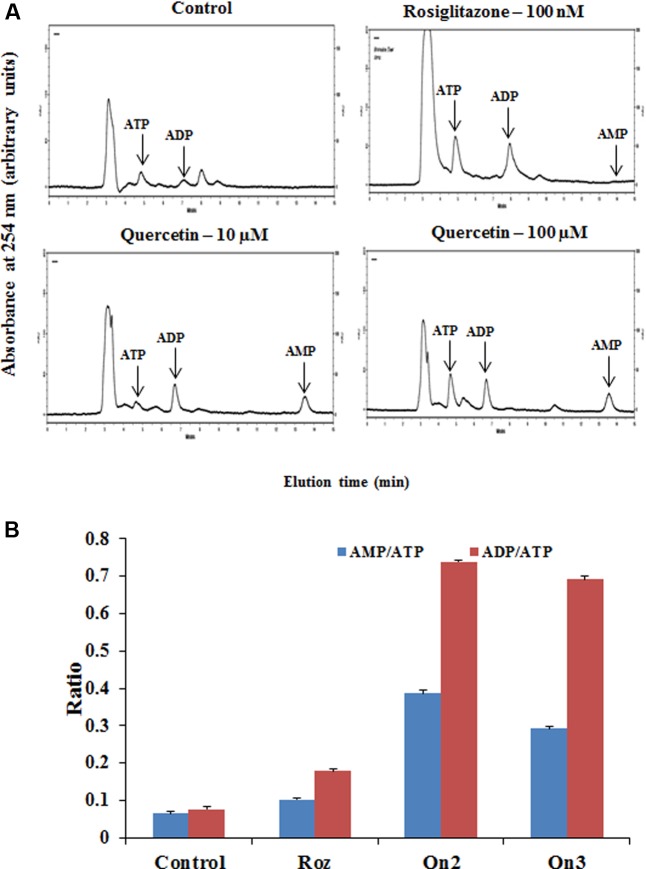
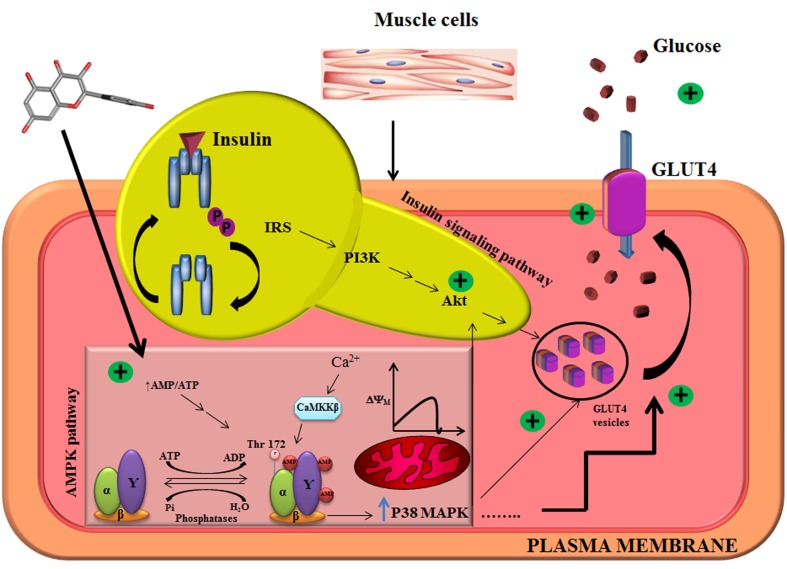
Herein we investigated the molecular mechanism of action of the citrus flavonoid, quercetin in skeletal muscle cells (L6 myotubes). Taking advantage of protein kinase inhibitors, we proved that the effect of quercetin on 2-NBDG uptake in L6 myotubes was not through insulin signaling pathway, but through adenosine monophosphate kinase (AMPK) pathway and its downstream target p38 MAPK. An increase in the cellular AMP to ATP ratio on pretreatment may account for AMPK activation which was coupled with a transient change in mitochondrial membrane potential. In addition, quercetin triggered a rise in intracellular calcium suggesting that calcium-calmodulin mediated protein kinase (CaMKK) may also be involved. Quercetin shared a similar mechanism with the well-known drug metformin, highlighting it as a promising compound for the management of type 2 diabetes. The AMPK signaling pathway could contribute to correction of insulin resistance through bypassing the insulin-regulated system for GLUT4 translocation.

Keywords: AMPK; CaMMK; L6 myotubes; quercetin; type 2 diabetes.


Figures

FIGURE 1
FIGURE 1
Effect of inhibitors on 2-NBDG uptake. (A) Effect of PI3K inhibitor, wortmannin, on 2-NBDG uptake in L6 myotubes. L6 myotubes pretreated with wortmannin followed by co-incubation with Rozi: rosiglitazone (100 nM); Insulin (100 nM); Qn (2, 3): quercetin (10 and 100 μM) for 24 h. Each value represents mean ± SD (standard deviation) from triplicate measurements (n = 3) of three different experiments. Significance test between different groups was determined by using one way ANOVA followed by Duncan’s multiple range test the significance accepted at P ≤ 0.05. P ≤ 0.05 versus same groups with wortmannin. (B) Effect of AMPK inhibitor, Dorsomorphin, on 2-NBDG uptake in L6 myotubes. L6 myotubes pretreated with dorsomorphin followed by co-incubation with Rozi: rosiglitazone (100 nM); Qn (2, 3): quercetin (10 and 100 μM) for 24 h. Each value represents mean ± SD (standard deviation) from triplicate measurements (n = 3) of three different experiments. Significance test between different groups was determined by using one way ANOVA followed by Duncan’s multiple range test the significance accepted at P ≤ 0.05.P ≤ 0.05 versus same groups with dorsomorphin.
FIGURE 2
FIGURE 2
Analysis of adenine nucleotide levels in L6 myotubes. (A) Effect of quercetin on cellular nucleotide levels. The effect of different treatments (Rozi: rosiglitazone (100 nM); Qn (2, 3): quercetin (10 and 100 μM) on cellular nucleotides was determined by HPLC. In each case, a representative trace is shown. The position at which ATP, ADP and AMP standards eluted are approximately 5.4, 7.02, and 13.5 min, respectively, as indicated on each trace by arrows. (B) Adenine nucleotides ratio in L6 myotubes. The ratio of AMP to ATP and ADP to ATP are depicted in the above bar diagram. Adenine nucleotide concentrations and hence ratio changes on citrus flavonoids pretreatment. Rozi: rosiglitazone (100 nM); Qn (2, 3): quercetin (10 and 100 μM). Data are the mean results of three independent experiments ± SD.
FIGURE 3
FIGURE 3
Change in membrane potential and intracellular calcium levels in L6 myotubes. (A) Fluorescence intensity analysis of red and green fluorescence. Relative fluorescence intensity was analyzed by BD Image Data Explorer software. There was a shift from red to green fluorescence on quercetin pretreatment indicating a transient change in mitochondrial transmembrane potential. Control: Untreated cells; Positive: Valinomycin treated, Rozi: rosiglitazone (100 nM); Qn (2, 3): quercetin (10 and 100 μM). Each value represents mean ± SD (standard deviation) from triplicate measurements (n = 3) of three different experiments. Significance test between different groups was determined by using one way ANOVA followed by Duncan’s multiple range test the significance accepted at P ≤ 0.05. P ≤ 0.05 versus Untreated Control. (B) Fluorescence intensity analysis of intracellular calcium levels. Relative fluorescence intensity in L6 myotubes was determined by using Fura-2AM by BD Image Data Explorer software. Untreated cells (Control cells); Rozi: rosiglitazone (100 nM); Qn (2, 3): quercetin (10 and 100 μM). Significance test between different groups was determined by using one way ANOVA followed by Duncan’s multiple range test the significance accepted at P ≤ 0.05. P ≤ 0.05 versus Untreated Control. (C) Fluorescent images of cytosolic calcium levels in L6 myotubes. Fluorescent images of cytosolic calcium levels in L6 myotubes were determined by using Fura-2AM. Untreated cells (Control cells); Rozi: rosiglitazone (100 nM); Qn (2, 3): quercetin (10 and 100 μM). Scale bar corresponds to 87 μM.
FIGURE 4
FIGURE 4
mRNA and protein expression in L6 myotubes on pretreatment of quercetin. (A) mRNA levels in L6 myotubes on pretreatment. The bar graph shows the mRNA levels (mean ± SE) of GLUT 4, CaMKK, AMPK, MAPK, PI3K, Akt and Irs in L6 myotubes on pretreatment of quercetin. The mRNA levels (arbitrary units) are expressed in relative to those of control cells. Quercetin (10 and 100 μM):Qn2 and Qn3. Significance test between different groups were determined by using one way ANOVA followed by Duncan’s multiple range test the significance accepted at P ≤ 0.05. P ≤ 0.05 versus Untreated Control. (B) Protein expression in L6 myotubes. The effect of quercetin (10 and 100 μM): Qn2 and Qn3 on pretreatment for 24 h was comparable with that of the positive control rosiglitazone (100 nM). Significance test between different groups were determined by using one way ANOVA followed by Duncan’s multiple range test the significance accepted at P ≤ 0.05. P ≤ 0.05 verses untreated control.
FIGURE 5
FIGURE 5
Illustration of mechanistic action of quercetin in L6 myotubes. Quercetin pretreatment in L6 myotubes enhanced AMP to ATP ratio which resulted in a transient change in mitochondrial membrane potential. There was also an associated increase in intracellular calcium level, which resulted in the activation of AMPK and its downstream target P38MAPK. Akt was also upregulated pointing to the conclusion that quercetin follows AMPK pathway, and it overlaps with insulin signaling pathway.

References

    1. Bailey C. J., Turner S. L. (2004). Glucosamine-induced insulin resistance in L6 muscle cells. Diabetes. Obes. Metab. 6 293–298. 10.1111/j.1462-8902.2004.00350 - DOI - PubMed
    1. Breen D. M., Sanli T., Giacca A., Tsiani E. (2008). Stimulation of muscle cell glucose uptake by resveratrol through sirtuins and AMPK. Biochem. Biophysci. Res. Commun. 374 117–122. 10.1016/j.bbrc.2008.06.104 - DOI - PubMed
    1. Cheng Z., Pang T., Gu M., Gao A. H., Xie C. M., Li J. Y., et al. (2006). Berberine-stimulated glucose uptake in L6 myotubes involves both AMPK and p38 MAPK. Biochim. Biophys. Acta 1760 1682–1689. 10.1016/j.bbagen.2006.09.007 - DOI - PubMed
    1. DeFronzo R. A., Tripathy D. (2009). Skeletal muscle insulin resistance is the primary defect in type 2 diabetes. Diabetes Care 32 S157–S163. 10.2337/dc09-S302 - DOI - PMC - PubMed
    1. Deng X., Zhang W., Williams J. B., Dong Q., Park E. A., Raghow R. (2012). FoxO1 inhibits sterol regulatory element-binding protein-1c (SREBP-1c) gene expression via transcription factors Sp1 and SREBP-1c. J. Biol. Chem. 287 20132–20143. 10.1074/jbc.M112.347211 - DOI - PMC - PubMed

LinkOut - more resources