. 2017 Jun 8:8:358.
doi: 10.3389/fphar.2017.00358. eCollection 2017.

Tacrolimus Updated Guidelines through popPK Modeling: How to Benefit More from CYP3A Pre-emptive Genotyping Prior to Kidney Transplantation

Affiliations

Tacrolimus Updated Guidelines through popPK Modeling: How to Benefit More from CYP3A Pre-emptive Genotyping Prior to Kidney Transplantation

Jean-Baptiste Woillard et al. Front Pharmacol. .

Abstract

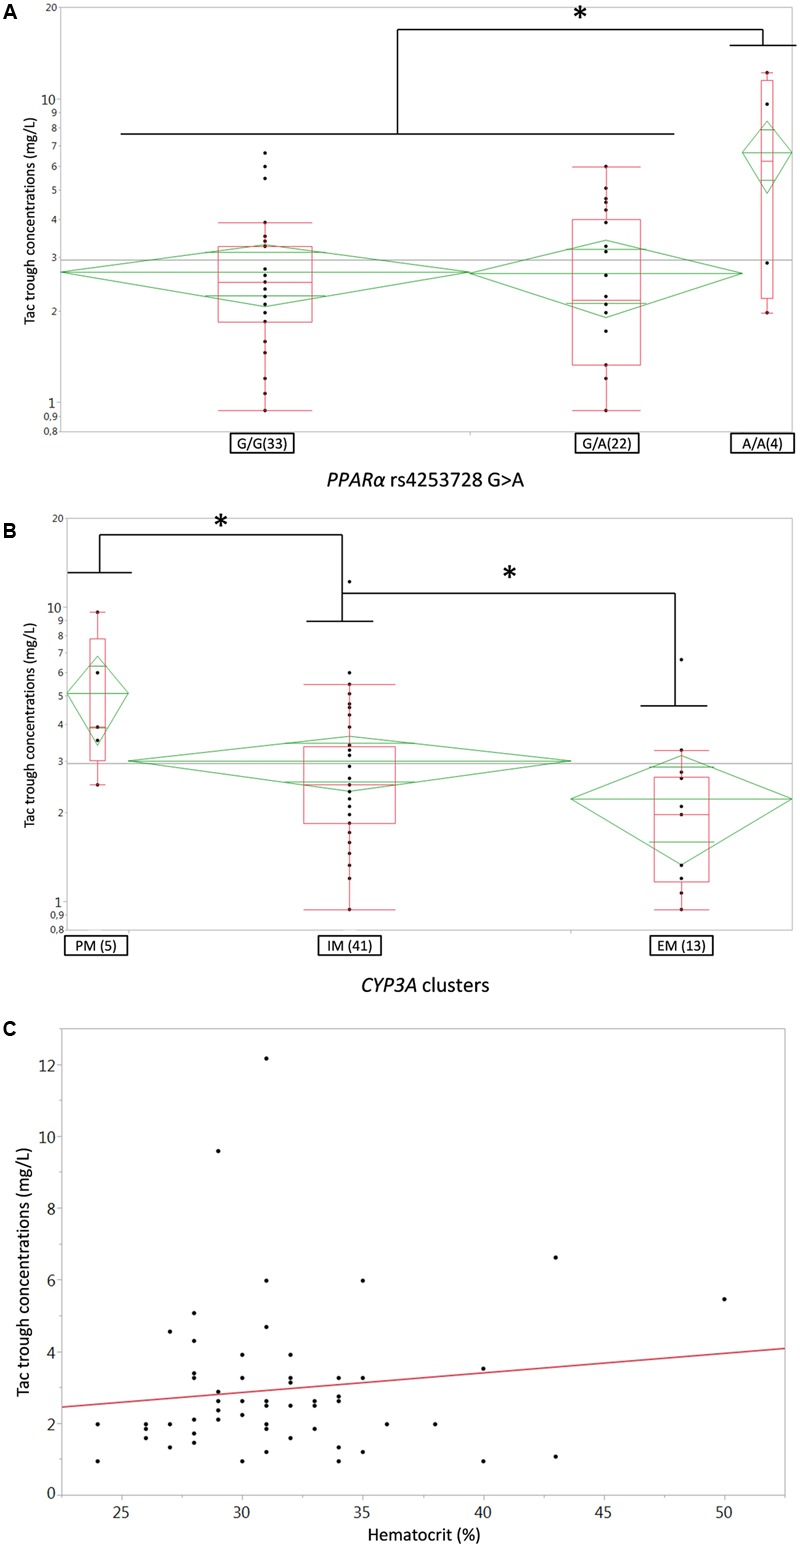
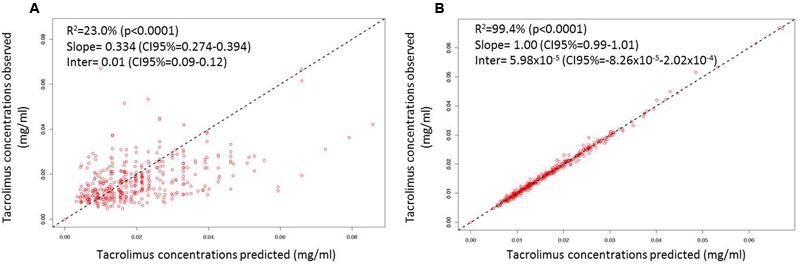
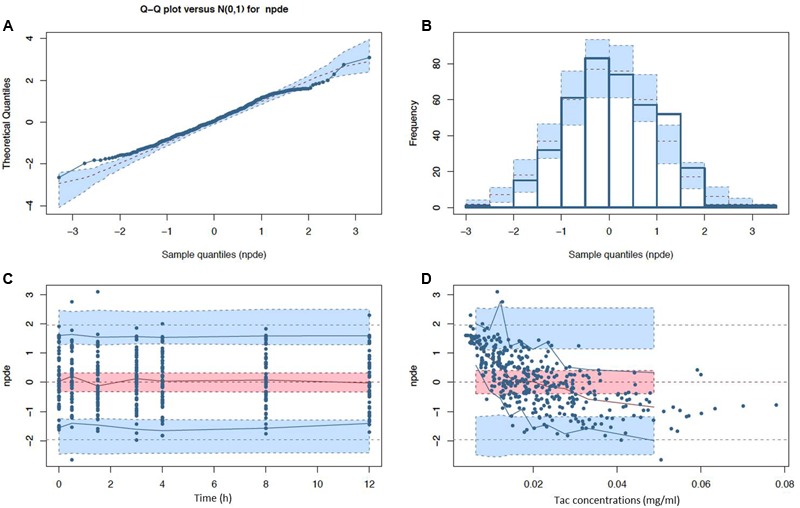
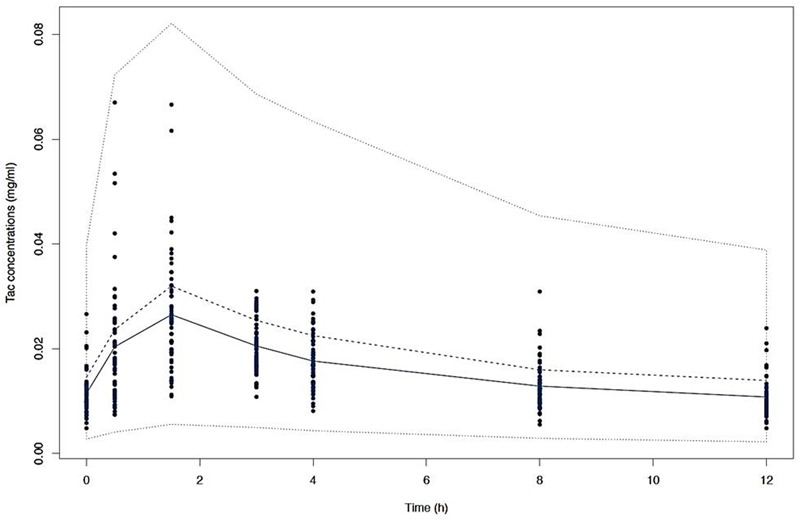
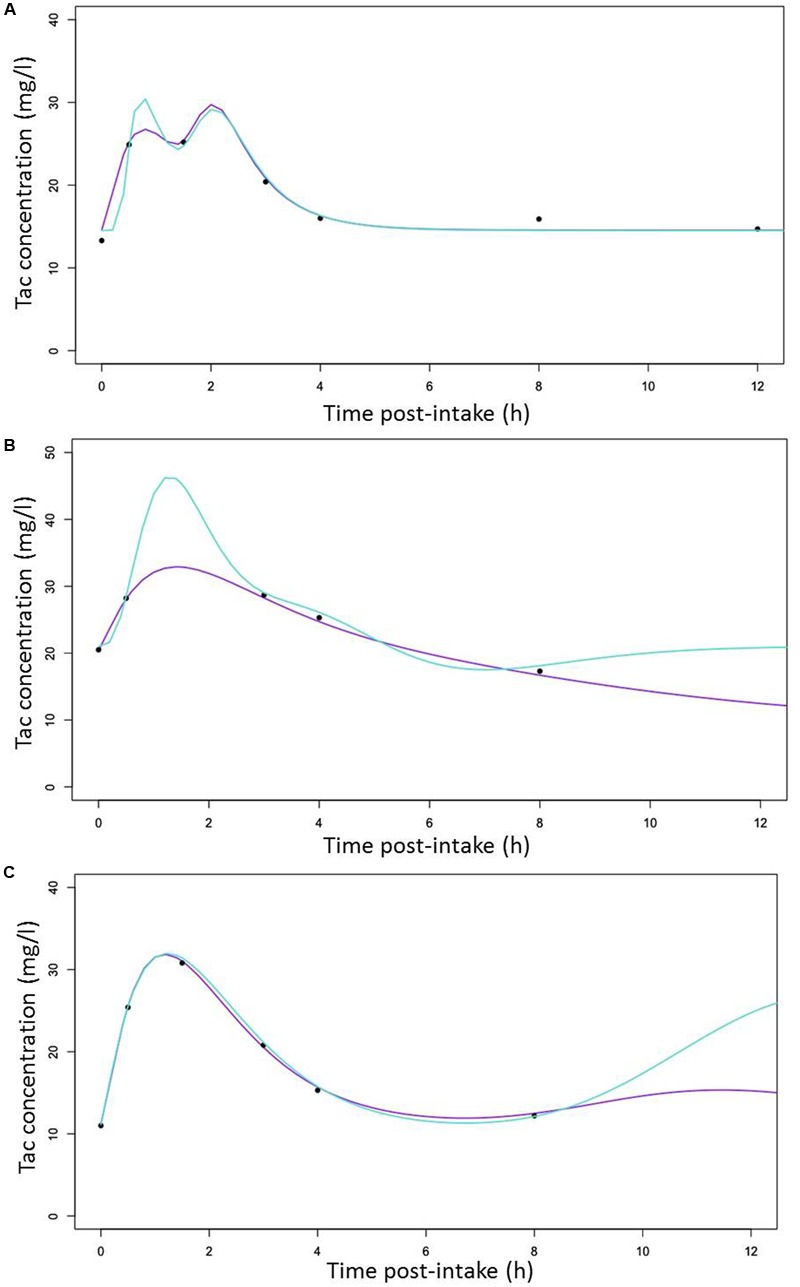
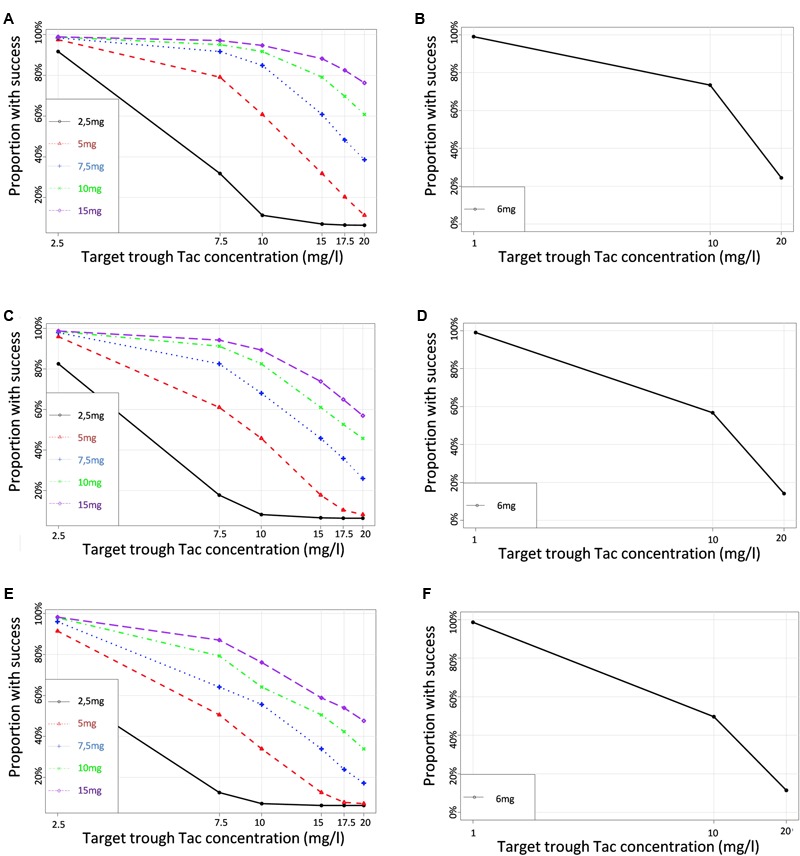
Tacrolimus (Tac) is a profoundly effective immunosuppressant that reduces the risk of rejection after solid organ transplantation. However, its use is hampered by its narrow therapeutic window along with its highly variable pharmacological (pharmacokinetic [PK] and pharmacodynamic [PD]) profile. Part of this variability is explained by genetic polymorphisms affecting the metabolic pathway. The integration of CYP3A4 and CY3A5 genotype in tacrolimus population-based PK (PopPK) modeling approaches has been proven to accurately predict the dose requirement to reach the therapeutic window. The objective of the present study was to develop an accurate PopPK model in a cohort of 59 kidney transplant patients to deliver this information to clinicians in a clear and actionable manner. We conducted a non-parametric non-linear effects PopPK modeling analysis in Pmetrics®. Patients were genotyped for the CYP3A422 and CYP3A53 alleles and were classified into 3 different categories [poor-metabolizers (PM), Intermediate-metabolizers (IM) or extensive-metabolizers (EM)]. A one-compartment model with double gamma absorption route described very accurately the tacrolimus PK. In covariate analysis, only CYP3A genotype was retained in the final model (Δ-2LL = -73). Our model estimated that tacrolimus concentrations were 33% IC95%[20-26%], 41% IC95%[36-45%] lower in CYP3A IM and EM when compared to PM, respectively. Virtually, we proved that defining different starting doses for PM, IM and EM would be beneficial by ensuring better probability of target concentrations attainment allowing us to define new dosage recommendations according to patient CYP3A genetic profile.

Keywords: CYP3A; dosage recommendations; kidney transplantation; population pharmacokinetics; single nucleotide polymorphisms; tacrolimus.


Figures

FIGURE 1
FIGURE 1
(A,B) Box-and-whisker plots of Tac C0 (ng/ml) according to (A) PPARa rs4253728G > A SNP or (B) CYP3A genotype clusters. The boxes depict the interquartile ranges (IQR) with the bottom and the top of the boxes representing the first (Q1) and third quartiles (Q3), respectively, and the band inside the boxes indicating the medians (Q2), the whiskers link the box with Q1+1.5xIQR and Q3+1.5xIQR and the diamonds represents the means (diagonal) with their respectiveIC95%; (C) linear regression plot of Tac C0 (ng/ml) on the Y-axis versus Hematocrit (%) on the X-axis; each dot represents a couple of data for one individual patient, the solid red line represents the fitted linear regression line. PM, poor metabolizer, IM, intermediate metabolizers, EM, extensive metabolizers. p < 0.05.
FIGURE 2
FIGURE 2
Linear regression of individual observed versus predicted Tac concentrations using (A) mean model PK parameter values and (B) the means of the individual Bayesian posterior parameter distributions. The dashed lines represent the unity lines.
FIGURE 3
FIGURE 3
Normalized prediction distribution error (npde) diagnostic plots (A) Q-Q plot and (B) histogram with expected normal distributions indicated by the dashed lines and light blue boxes (mean and CI95% ranges) and (C) npde with respect to post-intake time (D) and predicted Tac concentration with observed (solid lines) and expected (dashed lines) npde means (red), 5th and 95th percentiles (blue) with their corresponding CI95% (filled ranges).
FIGURE 4
FIGURE 4
Visual predictive check (VPC) of simulated concentrations (dashed lines) represented by the 10th, 50th, and 90th percentiles versus time with the mean observed Tac concentrations (solid line) and the individual values (dots).
FIGURE 5
FIGURE 5
Random selection of Individual predicted Tac concentrations versus time curves (lines) with observed Tac concentrations represented by cross symbols (x) for (A) a CYP3A poor metabolizers (B) a CYP3A Intermediate metabolizers (C) a CYP3A extensive metabolizers with predicted line generated with the structural (turquoise) and the covariate (purple) models, respectively.
FIGURE 6
FIGURE 6
Proportions of simulated patients achieving different Tac C0 targets with various dosage regimens in (A,B) CYP3A poor metabolizers (C,D) CYP3A Intermediate metabolizers (E,F) CYP3A extensive metabolizers. Left panels correspond to the simulation performed for a set of virtual dosages, and right panels simulations performed for the actual initial dosage that was really given to the patients.

References

    1. Andreu F., Colom H., Elens L., van Gelder T., van Schaik R. H., Hesselink D. A., et al. (2017). A new CYP3A53 and CYP3A422 cluster influencing tacrolimus target concentrations: a population approach. Clin Pharmacokinet. 10.1007/s40262-016-0491-3 [Epub ahead of print]. - DOI - PubMed
    1. Anglicheau D., Verstuyft C., Laurent-Puig P., Becquemont L., Schlageter M. H., Cassinat B., et al. (2003). Association of the multidrug resistance-1 gene single-nucleotide polymorphisms with the tacrolimus dose requirements in renal transplant recipients. J. Am. Soc. Nephrol. 14 1889–1896. - PubMed
    1. Asberg A., Midtvedt K., van Guilder M., Storset E., Bremer S., Bergan S., et al. (2013). Inclusion of CYP3A5 genotyping in a nonparametric population model improves dosing of tacrolimus early after transplantation. Transpl. Int. 26 1198–1207. 10.1111/tri.12194 - DOI - PMC - PubMed
    1. Benkali K., Premaud A., Picard N., Rerolle J. P., Toupance O., Hoizey G., et al. (2009). Tacrolimus population pharmacokinetic-pharmacogenetic analysis and Bayesian estimation in renal transplant recipients. Clin. Pharmacokinet. 48 805–816. 10.2165/11318080-000000000-00000 - DOI - PubMed
    1. Bigdeli T. B., Neale B. M., Neale M. C. (2014). Statistical properties of single-marker tests for rare variants. Twin Res. Hum. Genet. 17 143–150. 10.1017/thg.2014.17 - DOI - PubMed