

Defining an Optimal Cut-Point Value in ROC Analysis: An Alternative Approach
- PMID: 28642804
- PMCID: PMC5470053
- DOI: 10.1155/2017/3762651
Defining an Optimal Cut-Point Value in ROC Analysis: An Alternative Approach
Abstract
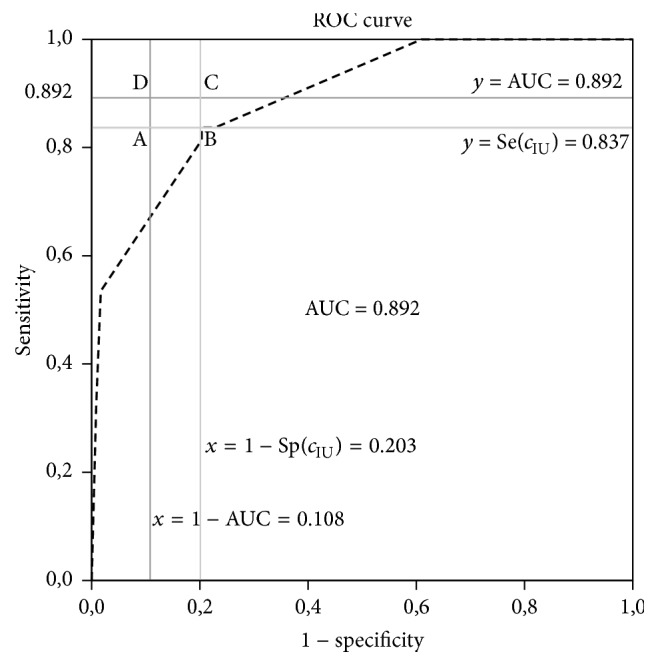
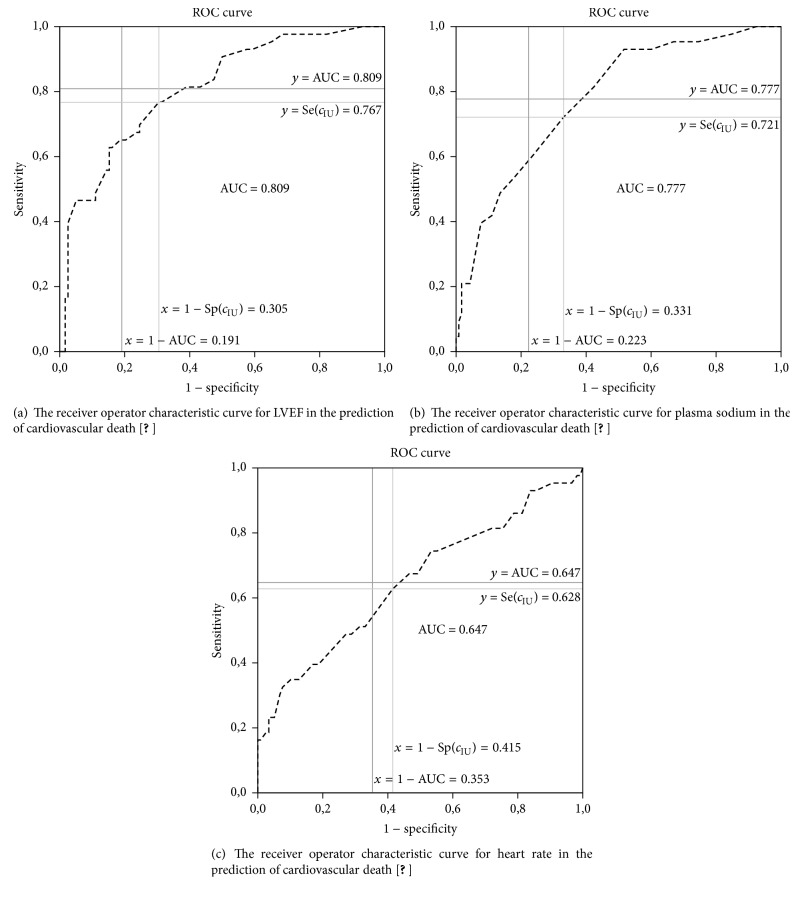
ROC curve analysis is often applied to measure the diagnostic accuracy of a biomarker. The analysis results in two gains: diagnostic accuracy of the biomarker and the optimal cut-point value. There are many methods proposed in the literature to obtain the optimal cut-point value. In this study, a new approach, alternative to these methods, is proposed. The proposed approach is based on the value of the area under the ROC curve. This method defines the optimal cut-point value as the value whose sensitivity and specificity are the closest to the value of the area under the ROC curve and the absolute value of the difference between the sensitivity and specificity values is minimum. This approach is very practical. In this study, the results of the proposed method are compared with those of the standard approaches, by using simulated data with different distribution and homogeneity conditions as well as a real data. According to the simulation results, the use of the proposed method is advised for finding the true cut-point.
Figures
References
-
- Zhou X.-H., Obuchowski N. A., McClish D. K. Statistical Methods in Diagnostic Medicine. New York: Wiley-Interscience [John Wiley & Sons]; 2002. (Wiley Series in Probability and Statistics). - DOI
-
- Zweig M. H., Campbell G. Receiver-operating characteristic (ROC) plots: a fundamental evaluation tool in clinical medicine. Clinical Chemistry. 1993;39(4):561–577. - PubMed
-
- Pepe M. S. The Statistical Evaluation of Medical Tests for Classification and Prediction. Vol. 28. Oxford, UK: Oxford University Press; 2003. (Oxford Statistical Science Series).
MeSH terms
Substances
LinkOut - more resources
Full Text Sources
Other Literature Sources
