. 2016 Jun;2(2):69-81.
doi: 10.1016/j.trci.2016.02.004.

Dissociation of Down syndrome and Alzheimer's disease effects with imaging

Affiliations

Dissociation of Down syndrome and Alzheimer's disease effects with imaging

Dawn C Matthews et al. Alzheimers Dement (N Y). 2016 Jun.

Abstract

Introduction: Down Syndrome (DS) adults experience accumulation of Alzheimer's disease (AD)-like amyloid plaques and tangles and a high incidence of dementia and could provide an enriched population to study AD-targeted treatments. However, to evaluate effects of therapeutic intervention, it is necessary to dissociate the contributions of DS and AD from overall phenotype. Imaging biomarkers offer the potential to characterize and stratify patients who will worsen clinically but have yielded mixed findings in DS subjects.

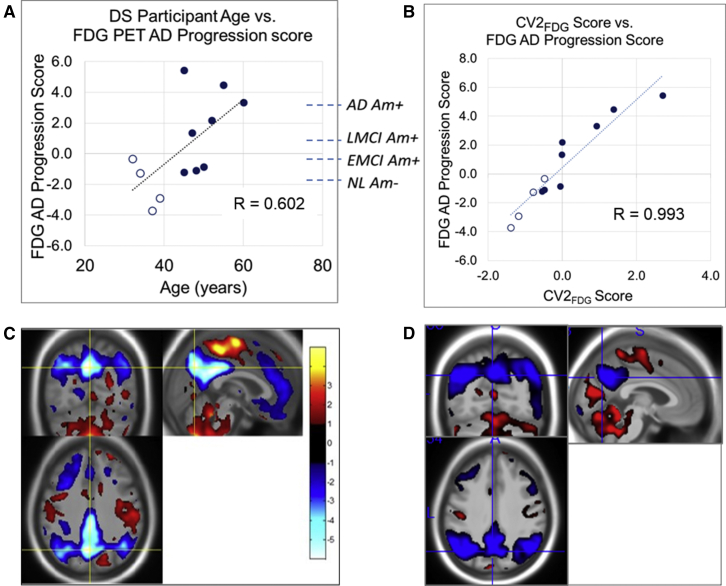
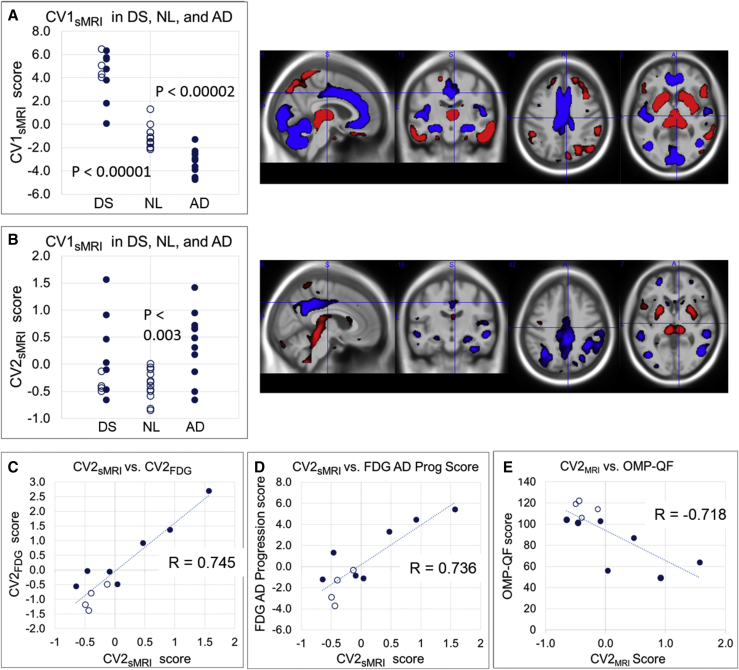
Methods: We evaluated 18F fluorodeoxyglucose positron emission tomography (PET), florbetapir PET, and structural magnetic resonance (sMR) image data from 12 nondemented DS adults using advanced multivariate machine learning methods.

Results: Our results showed distinctive patterns of glucose metabolism and brain volume enabling dissociation of DS and AD effects. AD-like pattern expression corresponded to amyloid burden and clinical measures.

Discussion: These findings lay groundwork to enable AD clinical trials with characterization and disease-specific tracking of DS adults.

Keywords: AV-45; Alzheimer’s; Amyloid; Biomarker initiative; Classifier; Clinical trials; DSBI; Down syndrome; FDG; Glucose metabolism; Imaging; MRI; NPAIRS; PET; Prodromal.


Figures

Fig. 1
Fig. 1
Results of 3-class FDG PET NPAIRS analysis. (A) DS-specific (CV1FDG) and (B) AD-specific (differentiates AD vs NL, CV2FDG) patterns are shown from the three-class FDG PET analysis. The numeric scores (circles) in the graph reflects the degree to which each subject expresses the corresponding pattern of relative hypo (blue) and hyper (red) metabolism (higher score on y-axis corresponds to greater pattern expression). Unfilled circles indicate amyloid negative or threshold, and filled circles indicate amyloid positive. DS subjects who were amyloid negative or at threshold as measured by florbetapir PET are shown as unfilled circles to the left of those who were amyloid positive (filled circles). Abbreviation: FDG, fluorodeoxyglucose; PET, positron emission tomography; DS, Down syndrome; AD, Alzheimer's disease; NL, cognitively normal amyloid negative.
Fig. 2
Fig. 2
Comparison of FDG AD progression classifier and CV2FDG. (A) AD progression scores of Down syndrome subjects and correlation with subject age are plotted. Dotted lines show mean AD progression scores of independently tested amyloid-characterized subjects from the ADNI database as references (NL = cognitively normal amyloid negative, EMCI = early MCI, LMCI = late MCI); (B) Relationship between three-class FDG PET CV2FDG scores and FDG AD progression scores; (C) FDG PET AD progression classifier pattern (eigenimage); (D) CV2FDG pattern. Blue = relative hypometabolism, Red = relative hyper or preserved metabolism. Abbreviation: FDG, fluorodeoxyglucose; PET, positron emission tomography; DS, Down syndrome; AD, Alzheimer's disease; ADNI, Alzheimer's Disease Neuroimaging Initiative.
Fig. 3
Fig. 3
FDG PET region of interest results. The posterior cingulate-precuneus (A) and inferior parietal cortex (B) region of interest SUVR values are shown, normalized to whole brain, for DS Am−, DS Am+, NL Am−, EMCI Am+, LMCI Am+, and AD Am+ subjects. Asterisks indicate nonparametric comparison test (Wilcoxon−Mann−Whitney) significance levels (*P < .05, **P < .005, tr = trend). P < .005 remained significant after Bonferroni correction for multiple comparisons. In c and d, relationships between regional SUVR values and age are shown for DS, NL (green diamonds), and AD subjects (red triangles). For the DS subjects in (C) and (D), unfilled circles are amyloid negative or threshold, and filled circles are amyloid positive. Abbreviation: FDG, fluorodeoxyglucose; PET, positron emission tomography; DS, Down syndrome; NL = cognitively normal amyloid negative, EMCI, early MCI; LMCI, late MCI; AD, Alzheimer's disease.
Fig. 4
Fig. 4
Correlations between FDG and amyloid PET measures and clinical data. (A) CV2FDG score in DS subjects vs cognitive and functional measures at baseline, and (B) Amyloid SUVR in DS subjects vs cognitive and functional measures at baseline. The FDG values correlate with clinical endpoints throughout the spectrum of scores. In contrast, although there is a general correlation between amyloid negative vs amyloid positive status and clinical endpoints, the correlation no longer holds within the amyloid positive subgroups (second set of dotted lines). Spearman's R values are shown.
Fig. 5
Fig. 5
Structural MRI analysis results. (A) Down syndrome associated pattern (CV1sMRI) and (B) AD associated pattern derived from the three-class MRI NPAIRS analysis. The numeric score for each subject (circle) reflects the degree to which they express the corresponding pattern of relatively lower volume (blue) and greater volume (red). A higher y-axis score corresponds to greater pattern expression. Unfilled circles = amyloid negative, filled circles = amyloid positive. DS subjects who were amyloid negative or threshold are shown as unfilled circles to the left of the DS Am + subjects (filled circles). Both patterns contain elements that combine to differentiate NL and AD. (C)–(E) show correlations (Spearman's R values) between CV2sMRI scores vs CV2FDG scores, FDG AD progression scores, and OMQ-PF score, respectively.

References

    1. Head E., Powell D., Gold B.T., Schmitt F.A. Alzheimer's Disease in DS. Eur J Neurodegener Dis. 2012;1:353–364. - PMC - PubMed
    1. Ness S., Rafii M., Aisen P., Krams M., Silverman W., Manji H. Down's syndrome and Alzheimer's disease: towards secondary prevention. Nat Rev Drug Discov. 2012;11:655–656. - PubMed
    1. Rafii M.S., Wishnek H., Brewer J.B., Donohue M.C., Ness S., Mobley W.C. The Down Syndrome Biomarker Initiative (DSBI) Pilot: Proof of Concept for Deep Phenotyping of Alzheimer's Disease Biomarkers in Down Syndrome. Front Behav Neurosci. 2015;9:239. - PMC - PubMed
    1. Drzezga A., Lautenschlager N., Siebner H., Riemenschneider M., Willoch F., Minoshima S. Cerebral metabolic changes accompanying conversion of mild cognitive impairment into Alzheimer's disease: a PET follow-up study. Eur J Nucl Med Mol Imaging. 2003;30:1104–1113. - PubMed
    1. Mosconi L., Mistur R., Switalski R., Tsui W.H., Glodzik L., Li Y. FDG-PET changes in brain glucose metabolism from normal cognition to pathologically verified Alzheimer's disease. Eur J Nucl Med Mol Imaging. 2009;36:811–822. - PMC - PubMed