. 2017 Jun 15:8:15816.
doi: 10.1038/ncomms15816.

The genomic landscape of tuberous sclerosis complex

Affiliations

The genomic landscape of tuberous sclerosis complex

Katie R Martin et al. Nat Commun. .

Abstract

Tuberous sclerosis complex (TSC) is a rare genetic disease causing multisystem growth of benign tumours and other hamartomatous lesions, which leads to diverse and debilitating clinical symptoms. Patients are born with TSC1 or TSC2 mutations, and somatic inactivation of wild-type alleles drives MTOR activation; however, second hits to TSC1/TSC2 are not always observed. Here, we present the genomic landscape of TSC hamartomas. We determine that TSC lesions contain a low somatic mutational burden relative to carcinomas, a subset feature large-scale chromosomal aberrations, and highly conserved molecular signatures for each type exist. Analysis of the molecular signatures coupled with computational approaches reveals unique aspects of cellular heterogeneity and cell origin. Using immune data sets, we identify significant neuroinflammation in TSC-associated brain tumours. Taken together, this molecular catalogue of TSC serves as a resource into the origin of these hamartomas and provides a framework that unifies genomic and transcriptomic dimensions for complex tumours.


Conflict of interest statement

The authors declare no competing financial interests.

Figures

Figure 1
Figure 1. The mutational spectrum of TSC1 and TSC2 in TSC patient samples.
(a) SNVs and INDELs in TSC2 and TSC1 (each mutation shown only once per patient). (b) Large TSC2 deletion in 10-RA1 identified by SNP array. Black dots: log-R ratios (LRR) of probe intensities; lower panel: magnification of boxed region. (c) Intragenic TSC2 deletion in 63-UG1 identified by targeted sequencing; grey bars: read counts along TSC2; blue bars: exons. (d) Blue bars: large deletions in TSC2. X-axis is broken to accommodate 32-SEGA1 deletion. (e,f) Example CN-LOH events as involving TSC1 on chromosome 9q in 38-SEGA1 (e) and TSC2 on chromosome 16p in 27-SEGA1 (f). (g) Percentage of 66 TSC patients with a mutation in TSC1, TSC2 or neither (NMI). (h) Percentage of tumours with 1 or 2 TSC1/TSC2 mutations identified. (i) Percentage of TSC1/TSC2 mutant tumours with 2 hits. Only 1-hit lesions with all 3 DNA platforms completed included (Supplementary Data 2). (j) Percentage of germline and somatic TSC1/TSC2 mutations of each type. (k) Total number of TSC1/TSC2 mutations of each class for each lesion type. (l) Combinations of mutations in TSC1 and TSC2 mutant tumours. (m,n) Relative TSC2 (m) and TSC1 (n) mRNA expression in non-TSC tissues (n=11) and TSC lesions grouped by mutational status (TSC2 mutation: 1 (n=11) or 2 (n=14); TSC1 mutation: 1 (n=2) or 2 (n=3)). FDR-adjusted P values from individual Welch’s t-tests: **P<0.01; *P<0.05). Open circles represent individual tumours and bars represent mean and s.d. CN-LOH, copy-neutral loss-of-heterozygosity; CPM, counts per million; DEL, deletion; FS, frameshift; IFD, in-frame deletion; MS, missense; Mut, mutation; NMI, no mutation identified; NS, nonsense; SPL, splicing.
Figure 2
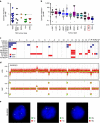
Figure 2. TSC lesions are infrequently mutated with large chromosome aberrations identified in a subset.
(a) Each symbol represents the number of somatic mutations, including point and INDELs, per Mb of genomic DNA. (b) Somatic mutations per Mb for cancerous and TSC lesions shown as boxes (25th to 75th percentile) and whiskers (5th to 95th percentile). Outliers shown as individual data points. (c) GISTIC was used to call whole and arm-level CNAs using processed SNP array data. Gains (3n) are shown in red and losses (1n) are shown in blue. (d) All CNAs were visually confirmed with genome-wide LRR and BAF plots. 29-SEGA1 is shown as an example. (e) FISH was used to confirm large CNAs. Representative nuclei, stained with DAPI in blue, show single fluorescent puncta using probes to chromosome 1p, 11p, 7p, 18p and 18q, and three fluorescent puncta using a probe to chromosome 5p, confirming losses and gains, respectively. AML, acute myeloid leukemia; BLCA, bladder urothelial carcinoma; BRCA, breast invasive carcinoma; COAD, colon adenocarcinoma; GBM, glioblastoma multiforme; HNSC, head and neck squamous cell carcinoma; KIRC, kidney renal clear cell carcinoma; LUAD, lung adenocarcinoma; LUSC, lung squamous cell carcinoma; OV, ovarian serous cystadenocarcinoma; READ, rectum adenocarcinoma; TSC, tuberous sclerosis complex; UCEC, uterine corpus endometrial carcinoma.
Figure 3
Figure 3. Shared methylation and transcriptional features of angiomyolipomas.
(a) The hypermethylation fraction of TSC tumours (boxes: 25th to 75th percentile; whiskers: minimum to maximum; line: median). (b) 240 RA-specific probes. Probe signal intensity shown from low (blue) to high (red). Samples annotated for germline mutation (blue: TSC2; red: TSC1), 1 or 2 TSC hits (germline + somatic mutation) with ‘1*’ indicating only 1 mutation found but data from targeted TSC1/TSC2 sequencing not available, and DNMT3A status (yellow: wild-type; orange: V716F somatic mutation). (c) Genes differentially expressed in RA tumours compared to non-TSC kidney samples (log2 fold-change +/− >2; adjusted P<0.001) coloured by log2 fold-changes according to the scale (blue: low; red: high). Top 5 upregulated and downregulated DEGs are indicated. (df) Normalized log2 CPM values for NPHS2, PMEL and CTSK for non-TSC kidney (NK; grey) and RA (green). Symbols represent single samples. Line: mean; error bars: s.d. (n=3 non-TSC kidney; n=11 RA). (g) The relative fraction of cell types estimated by CIBERSORT (red: leukocytes; grey: blood vessel; green: smooth muscle; orange: adipose; light blue: fetal kidney; dark blue: adult kidney). (h) H&E-stained tissue sections of 13-RA (showing smooth muscle surrounding vasculature and pockets of adipose tissue) and 17-RA1 (nearly exclusive adipose tissue). Scale bars, 500 μM.
Figure 4
Figure 4. Shared gene expression features of TSC-associated brain lesions.
(a,b) Genes differentially expressed in SEN/SEGA (a) or cortical tubers (TUB) (b) compared to non-TSC brain (NB) samples (log2 fold-change +/− >2; adjusted P<0.001) are coloured by log2-transformed fold-changes according to the scale (blue: low; red: high). Top 5 and top 3 increased and decreased DEGs are indicated for SEGAs (a) and cortical tubers (b), respectively. (c) Venn diagrams showing similarity in DEGs between TUB and SEGA (blue: decreased DEGs; red: increased DEGs). Circles are sized according to DEG number. (d) Molecular map of antigen processing and presentation modified from KEGG ID hsa04612. Genes are coloured according to log2 fold-changes in SEN/SEGA according to the legend.
Figure 5
Figure 5. Immune response is observed in TSC brain lesions.
(a) Relative fraction of cell types estimated by CIBERSORT (P<0.05). Orange: whole blood; red: leukocytes; dark blue: differentiated neuron; light blue: undifferentiated neuron; light green: fetal astrocyte; dark green: adult astrocyte. (b) Fold-change in transcript abundance in SEN/SEGA compared to non-TSC brains for three markers of neuronal differentiation. Lines: means; error bars: s.d. (c) Relative fractions of 22 immune cell types estimated by CIBERSORT. Those significantly enriched in SEN/SEGA compared to NB (FDR-adjusted P<0.05) are displayed as their relative fraction of leukocyte RNA per sample. (d) Fresh-frozen tissue sections from NB and SEGA were immunostained for CD68 (macrophages), HLA-DR (MHC-Class II) and AIF1/IBA1 (microglia). 66-NB1 and 32-SEGA1 are shown. Scale bars, 200 μM.

References

    1. Osborne J. P., Fryer A. & Webb D. Epidemiology of tuberous sclerosis. Ann. N. Y. Acad. Sci. 615, 125–127 (1991). - PubMed
    1. European Chromosome 16 Tuberous Sclerosis Consortium. Identification and characterization of the tuberous sclerosis gene on chromosome 16. Cell 75, 1305–1315 (1993). - PubMed
    1. Gomez M. R. Criteria for diagnosis. in Tuberous Sclerosis ed. Gomez M. R. 10–23Raven Press (1988).
    1. Roach E. S., Gomez M. R. & Northrup H. Tuberous sclerosis complex consensus conference: revised clinical diagnostic criteria. J. Child Neurol. 13, 624–628 (1998). - PubMed
    1. Krueger D. A. & Northrup H. International Tuberous Sclerosis Complex Consensus Group. Tuberous sclerosis complex surveillance and management: recommendations of the 2012 International Tuberous Sclerosis Complex Consensus Conference. Pediatr. Neurol. 49, 255–265 (2013). - PMC - PubMed

Publication types

MeSH terms

Substances