. 2017 Jun 23;14(7):675.
doi: 10.3390/ijerph14070675.

Within What Distance Does "Greenness" Best Predict Physical Health? A Systematic Review of Articles with GIS Buffer Analyses across the Lifespan

Affiliations

Within What Distance Does "Greenness" Best Predict Physical Health? A Systematic Review of Articles with GIS Buffer Analyses across the Lifespan

Matthew Browning et al. Int J Environ Res Public Health. .

Abstract

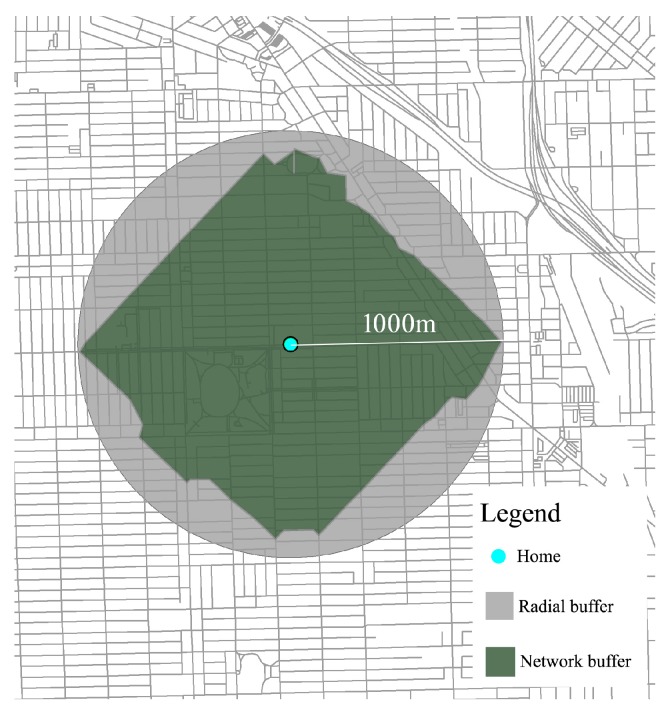
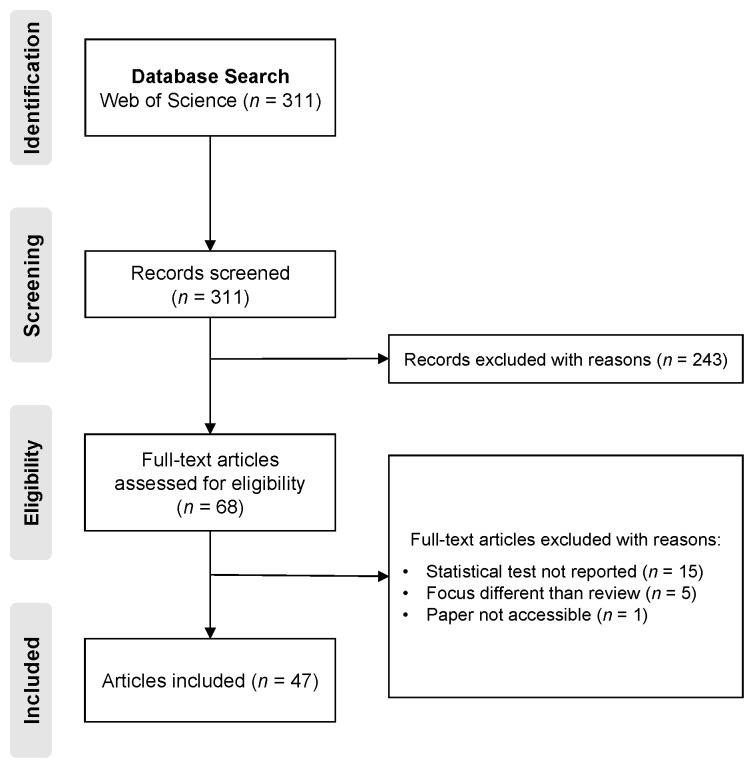
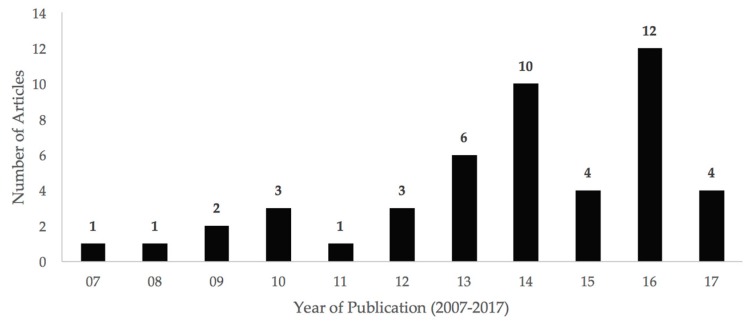
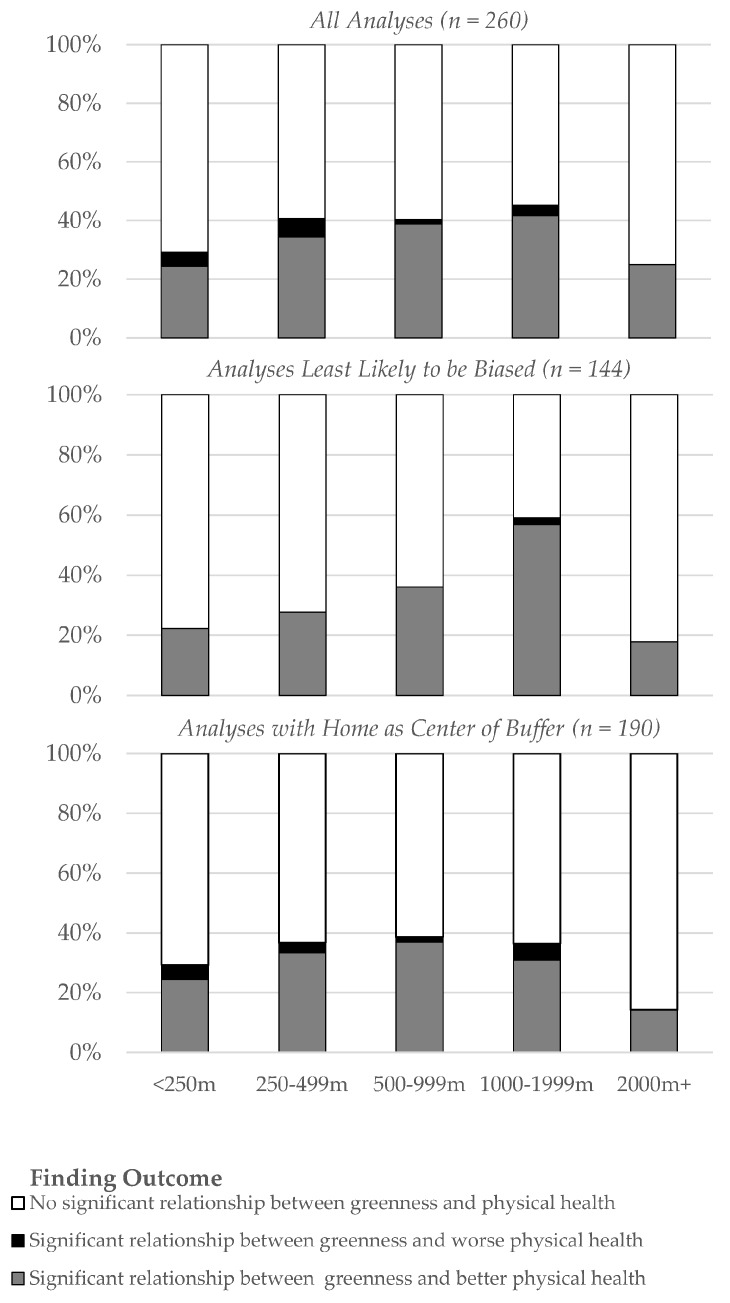
Is the amount of "greenness" within a 250-m, 500-m, 1000-m or a 2000-m buffer surrounding a person's home a good predictor of their physical health? The evidence is inconclusive. We reviewed Web of Science articles that used geographic information system buffer analyses to identify trends between physical health, greenness, and distance within which greenness is measured. Our inclusion criteria were: (1) use of buffers to estimate residential greenness; (2) statistical analyses that calculated significance of the greenness-physical health relationship; and (3) peer-reviewed articles published in English between 2007 and 2017. To capture multiple findings from a single article, we selected our unit of inquiry as the analysis, not the article. Our final sample included 260 analyses in 47 articles. All aspects of the review were in accordance with PRISMA guidelines. Analyses were independently judged as more, less, or least likely to be biased based on the inclusion of objective health measures and income/education controls. We found evidence that larger buffer sizes, up to 2000 m, better predicted physical health than smaller ones. We recommend that future analyses use nested rather than overlapping buffers to evaluate to what extent greenness not immediately around a person's home (i.e., within 1000-2000 m) predicts physical health.

Keywords: Geographic Information System (GIS); Normalized Difference Vegetation Index (NDVI); buffers; green space; greenness; health outcomes; park; physical health; systematic review.


Conflict of interest statement

The authors declare no conflict of interest.

Figures

Figure 1
Figure 1
Buffer analyses are tools to calculate the “greenness” of residential environments. Buffers are drawn two ways. Radial buffers (outer circle in gray) show greenness in the circle of a specified radius around a center point—in this case, 1000 m. Network buffers (inner polygon shape in green) show greenness in the region within a specified walking or driving distance of a center point.
Figure 2
Figure 2
Flow diagram of the screening of articles considered for inclusion in this review - conducted using the PRISMA process.
Figure 3
Figure 3
The number of articles using GIS buffer analyses to estimate the impact of greenness on physical health has increased over time, especially since 2013. Data for 2017 is incomplete because the review only included articles published before May 2017.
Figure 4
Figure 4
Articles studied populations from 17 countries, with the United States and Australia most commonly studied. Darker colors represent more articles on populations from that country.
Figure 5
Figure 5
Percent of analyses showing statistically significant relationships between greenness and physical health improvement increases as buffer size increases, but only to a point. In all analyses reviewed (top), the percent of significant findings increased up to 1000–1999 m buffers, but then decreased at larger buffer sizes. This trend was exaggerated when examining only those analyses least likely to be biased (middle), as indicated by their use of objective health measures and the inclusion of income or education as a confounding factor. Analyses that used buffers centered on home addresses—rather than postal codes or census tracts—showed a different tipping point (bottom). In this subsample, analyses demonstrated that greenness improves physical health in buffers up to 500–999 m in size—not 1000–1999 m.

References

    1. James P., Banay R.F., Hart J.E., Laden F. A review of the health benefits of greenness. Curr. Epidemiol. Rep. 2015;2:131–142. doi: 10.1007/s40471-015-0043-7. - DOI - PMC - PubMed
    1. Blanck H.M., Allen D., Bashir Z., Gordon N., Goodman A., Merriam D., Rutt C. Let’s go to the park today: The role of parks in obesity prevention and improving the public’s health. Child. Obes. 2012;8:423–428. doi: 10.1089/chi.2012.0085.blan. - DOI - PubMed
    1. McMorris O., Villeneuve P.J., Su J., Jerrett M. Urban greenness and physical activity in a national survey of Canadians. Environ. Res. 2015;137:94–100. doi: 10.1016/j.envres.2014.11.010. - DOI - PubMed
    1. Dadvand P., Sunyer J., Basagaña X., Ballester F., Lertxundi A., Fernández-Somoano A., Estarlich M., García-Esteban R., Mendez M.A., Nieuwenhuijsen M.J. Surrounding greenness and pregnancy outcomes in four Spanish birth cohorts. Environ. Health Perspect. 2012;120:1481–1487. doi: 10.1289/ehp.1205244. - DOI - PMC - PubMed
    1. Dadvand P., de Nazelle A., Figueras F., Basagaña X., Su J., Amoly E., Jerrett M., Vrijheid M., Sunyer J., Nieuwenhuijsen M.J. Green space, health inequality and pregnancy. Environ. Int. 2012;40:110–115. doi: 10.1016/j.envint.2011.07.004. - DOI - PubMed

Publication types

LinkOut - more resources