. 2017 Jul;9(7):667-675.
doi: 10.1038/nchem.2706. Epub 2017 Jan 30.

A synthetic ion transporter that disrupts autophagy and induces apoptosis by perturbing cellular chloride concentrations

Affiliations

A synthetic ion transporter that disrupts autophagy and induces apoptosis by perturbing cellular chloride concentrations

Nathalie Busschaert et al. Nat Chem. 2017 Jul.

Abstract

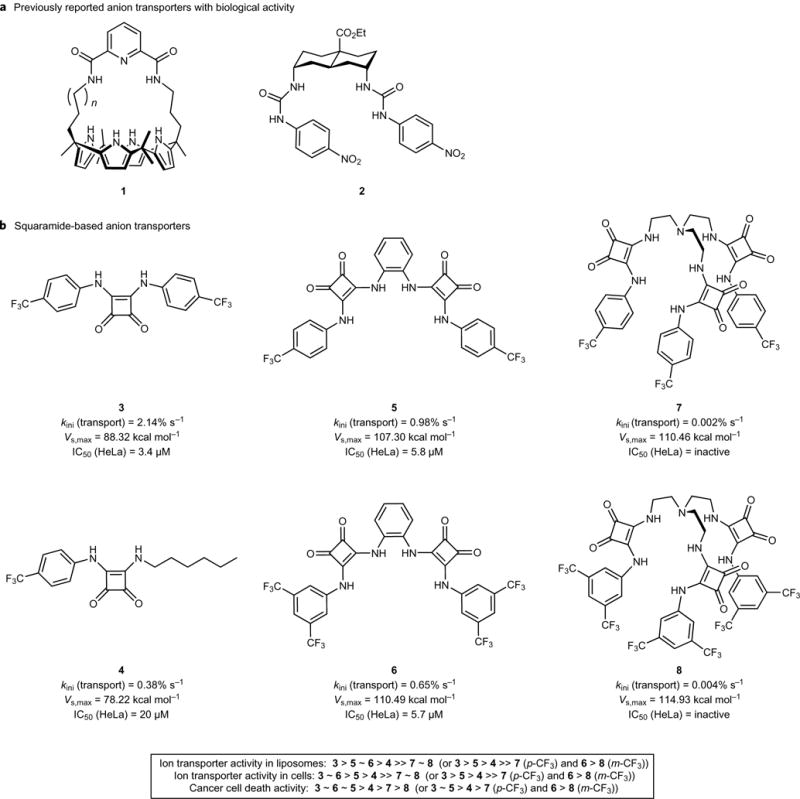
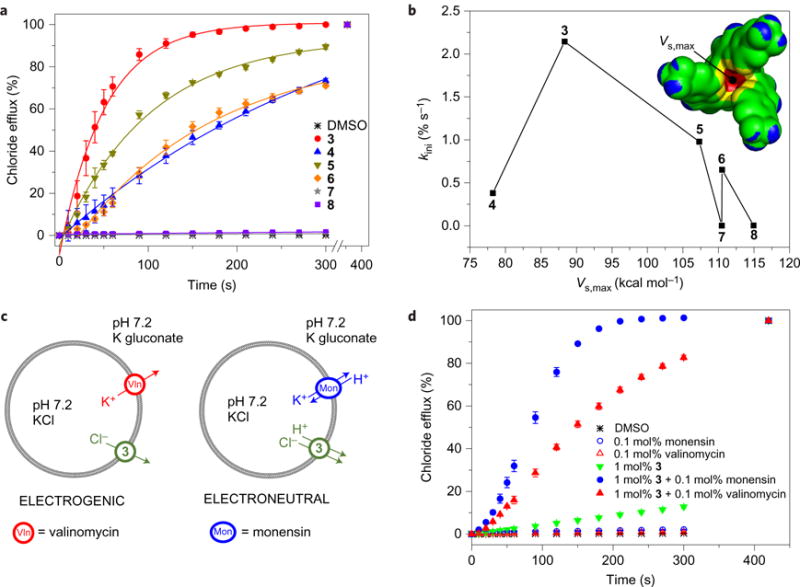
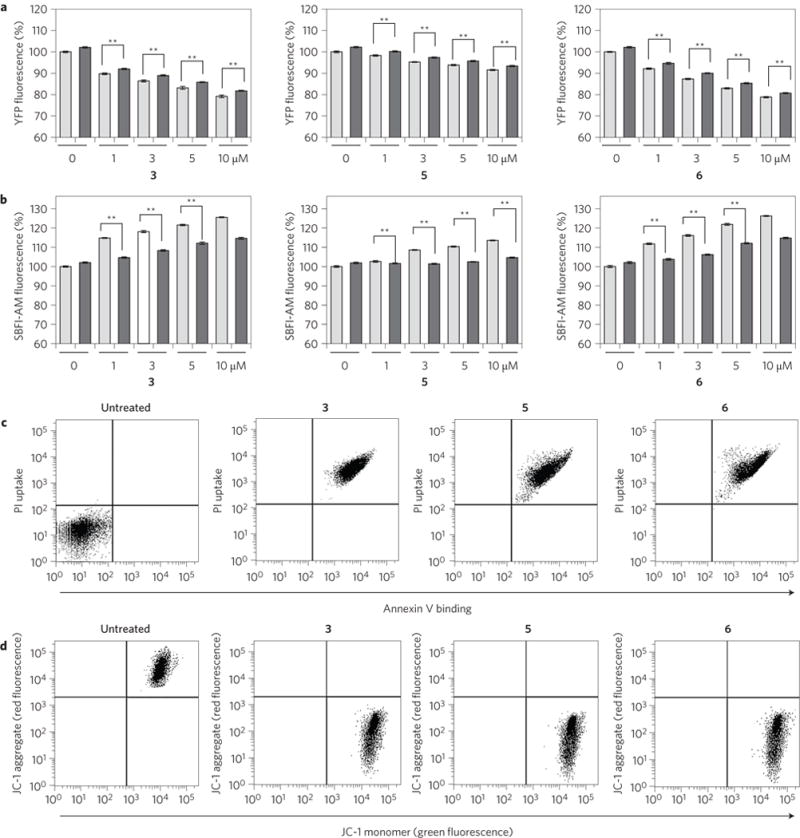
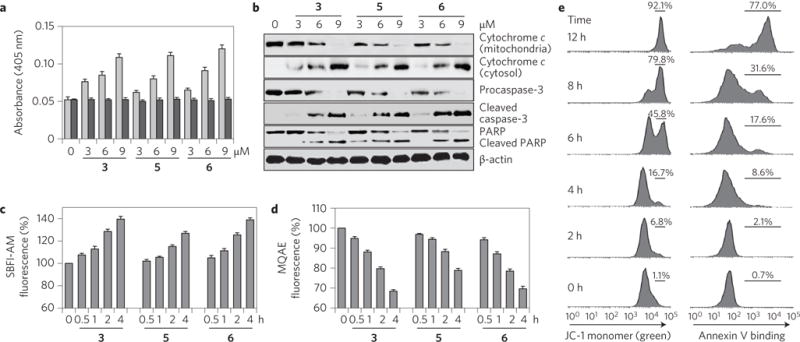
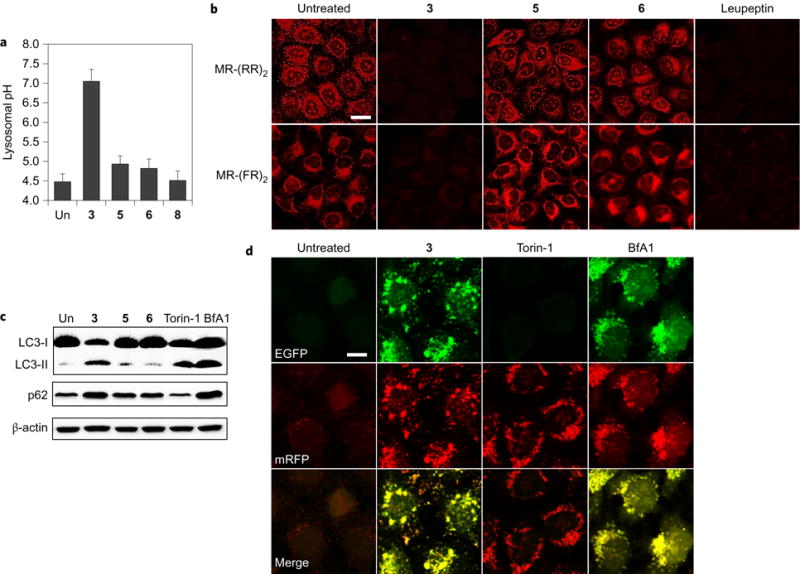
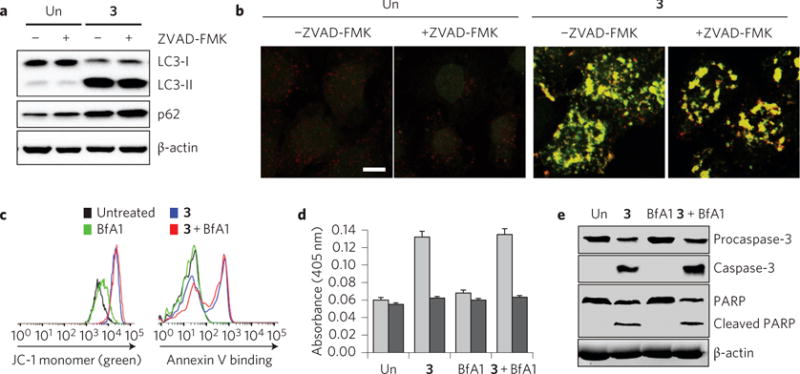
Perturbations in cellular chloride concentrations can affect cellular pH and autophagy and lead to the onset of apoptosis. With this in mind, synthetic ion transporters have been used to disturb cellular ion homeostasis and thereby induce cell death; however, it is not clear whether synthetic ion transporters can also be used to disrupt autophagy. Here, we show that squaramide-based ion transporters enhance the transport of chloride anions in liposomal models and promote sodium chloride influx into the cytosol. Liposomal and cellular transport activity of the squaramides is shown to correlate with cell death activity, which is attributed to caspase-dependent apoptosis. One ion transporter was also shown to cause additional changes in lysosomal pH, which leads to impairment of lysosomal enzyme activity and disruption of autophagic processes. This disruption is independent of the initiation of apoptosis by the ion transporter. This study provides the first experimental evidence that synthetic ion transporters can disrupt both autophagy and induce apoptosis.


Conflict of interest statement

Competing financial interests

The authors declare no competing financial interests.

Figures

Figure 1
Figure 1. Structure of anion transporters and their activity
a, Structures of previously reported anion transporters 1 and 2. b, Structures of squaramide-based anion transporters 38 and the initial rate of chloride transport mediated by 1 mol% transporter from liposomes filled with a buffered NaCl solution and submerged in a buffered NaNO3 solution (kini), calculated Vs,max values, and IC50 values towards HeLa cells. Inset: relative activity (from high to low) for the various transporters in different assays.
Figure 2
Figure 2. Ion transport studies using liposomal model membranes
a, Cl/NO3 antiport mediated by 38 (added as DMSO solutions; final concentration: 1 mol% w.r.t. lipid) from POPC vesicles loaded with 489 mM NaCl with 5 mM phosphate salts (pH 7.2) and suspended in a 489 mM NaNO3 solution with 5 mM phosphate salts (pH 7.2). Error bars represent standard deviations from three separate experiments, and lines correspond to the initial rate of transport (kini) calculations. b, Plot representing the correlation between the initial rate of transport (kini) and Vs,max. Inset: surface electrostatic potential with Vs,max of compound 7 (colour scale, from blue to red (in kcal mol−1): blue, lower than −7.5; green, between −7.5 and 40.0; yellow, between 40.0 and 87.5; red, greater than 87.5). c, Experimental set-up to determine electrogenic or electroneutral anion transport. POPC vesicles are loaded with 300 mM KCl with 5 mM phosphate salts (pH 7.2) and suspended in a 300 mM potassium gluconate solution with 5 mM phosphate salts (pH 7.2). Electrogenic K+ transport by valinomycin can only occur if it is balanced by electrogenic Cl transport by 3. Electroneutral K+/H+ antiport by monensin can only occur if the pH gradient is dissipated by electroneutral H+/Cl transport by 3. d, Results of the experiment described in c, showing both electrogenic and electroneutral anion transport by squaramide 3. Transporters are added as DMSO solutions to start the experiments (resulting in a final concentrations of 0.1 mol% w.r.t. lipid for valinomycin and monensin, and 1 mol% w.r.t. lipid for squaramide 3). Error bars represent standard deviations from three separate experiments.
Figure 3
Figure 3. Synthetic transporters induce apoptosis
a, FRT cells stably transfected with a mutant YFP gene were incubated with various concentrations of the indicated compounds for 2 h in the absence (grey bars) and presence (black bars) of 1 mM amiloride. YFP fluorescence was then measured to examine changes in intracellular chloride ion concentrations (mean ± s.d., n = 3, **P < 0.001, Student’s t-test). b, FRT cells pretreated with 10 μM SBFI-AM for 1.5 h were incubated with various concentrations of the indicated compounds for 2 h in the absence (grey bars) and presence (black bars) of 1 mM amiloride. SBFI-AM fluorescence was then measured to examine changes in intracellular sodium ion concentrations (mean ± s.d., n = 3, **P < 0.001, Student’s t-test). c, Flow cytometry of HeLa cells treated with 10 μM of indicated compounds for 18 h and stained with fluorescein-annexin V and PI (annexin V binding versus PI uptake). Untreated cells are shown as a negative control. d, Flow cytometry of HeLa cells treated with 10 μM of indicated compounds for 18 h and stained with JC-1 (red fluorescence (FL2, JC-1 aggregate) versus green fluorescence (FL1, JC-1 monomer)). Untreated cells are shown as a negative control.
Figure 4
Figure 4. Synthetic transporters induce caspase-dependent apoptosis
a, Caspase activities of lysates of HeLa cells treated with the indicated compounds for 18 h were measured by using 200 μM acetyl-DEVD-pNA in the absence (grey bars) and presence (black bars) of 20 μM Ac-DEVD-CHO (mean ± s.d., n = 3). b, HeLa cells were treated with the indicated compounds for 18 h. Immunoblotting was conducted using the corresponding antibodies. β-Actin was used as a loading control. c, HeLa cells pretreated with 10 μM SBFI-AM were incubated with 10 μM of the indicated compounds for the indicated times. The SBFI-AM fluorescence was then measured to probe changes in the intracellular sodium ion concentration (mean ± s.d., n = 3). d, HeLa cells pretreated with 10 mM MQAE for 1 h were incubated with 10 μM of each compound for the indicated times. The MQAE fluorescence was then measured to determine changes in the intracellular chloride ion concentration (mean ± s.d., n = 3). e, Flow cytometry of HeLa cells treated with 10 μM 3 for the indicated time and then stained with JC-1 (left) or fluorescein-annexin V (right).
Figure 5
Figure 5. Effect of synthetic transporters on autophagy
a, HeLa cells pretreated with fluorescein-tetramethylrhodamine-tagged dextran for 12 h were incubated with 10 μM of the indicated compounds for 12 h. The lysosomal pHs were calculated using a pH titration curve (shown in Supplementary Fig. 113) (mean ± s.d., n = 3). b, HeLa cells pretreated with 3 (4 μM), 5 (4 μM), 6 (4 μM) or leupeptin (5 μM) for 6 h were incubated with MR-(RR)2 or MR-(FR)2 for 4 h. Cell images were obtained using confocal fluorescence microscopy (scale bar, 20 μm). c, HeLa cells were treated with 3 (4 μM), 5 (4 μM), 6 (4 μM), torin-1 (1 μM) or BfA1 (5 nM) for 24 h. Expression levels of LC3 and p62 were examined using western blots. Torin-1 and BfA1 were used as controls for autophagy induction and inhibition, respectively. d, HeLa cells stably expressing mRFP-EGFP-LC3 were treated with 3 (4 μM), torin-1 (1 μM) or BfA1 (5 nM) for 24 h. Cell images were obtained using confocal fluorescence microscopy (scale bar, 10 μm).
Figure 6
Figure 6. Effect of apoptosis induction promoted by 3 is independent of its ability to disrupt autophagy
a, HeLa cells were treated for 12 h with 10 μM 3 in the absence and presence of 40 μM ZVAD-FMK. The indicated proteins were immunoblotted using the corresponding antibodies. ‘Un’ indicates no treatment of cells with 3. b, HeLa cells stably expressing mRFP-EGFP-LC3 were treated for 24 h with 10 μM 3 in the absence and presence of 40 μM ZVAD-FMK. Cell images of EGFP and mRFP, obtained using confocal fluorescence microscopy, were merged (scale bar, 10 μm). ‘Un’ indicates no treatment of cells with 3. c, Flow cytometry of HeLa cells treated with 10 μM 3 or/and 5 nM BfA1 for 12 h and then stained with JC-1 (left) or fluorescein-annexin V (right). ‘Untreated’ indicates no treatment of cells with 3 and BfA1. d, Caspase activities of lysates of HeLa cells treated with 10 μM 3 or/and 5 nM BfA1 for 12 h were measured using 200 μM acetyl-DEVD-pNA in the absence (grey bars) and presence (black bars) of 20 μM Ac-DEVD-CHO (mean ± s.d., n = 3). ‘Un’ indicates no treatment of cells with 3 and BfA1. e, HeLa cells were treated with 10 μM 3 or/and 5 nM BfA1 for 12 h. The indicated proteins were then immunoblotted by using the corresponding antibodies. ‘Un’ indicates no treatment of cells with 3 and BfA1.

References

    1. Mizushima N, Komatsu M. Autophagy: renovation of cells and tissues. Cell. 2011;147:728–741. - PubMed
    1. Ohsumi Y. Molecular dissection of autophagy: two ubiquitin-like systems. Nat Rev Mol Cell Biol. 2001;2:211–216. - PubMed
    1. Kuma A, et al. The role of autophagy during the early neonatal starvation period. Nature. 2004;432:1032–1036. - PubMed
    1. White E. Deconvoluting the context-dependent role for autophagy in cancer. Nat Rev Cancer. 2012;12:401–410. - PMC - PubMed
    1. Baek KH, Park J, Shin I. Autophagy-regulating small molecules and their therapeutic applications. Chem Soc Rev. 2012;41:3245–3263. - PubMed

Publication types