

Risk Stratification for Second Primary Lung Cancer
- PMID: 28644772
- PMCID: PMC5946715
- DOI: 10.1200/JCO.2017.72.4203
Risk Stratification for Second Primary Lung Cancer
Abstract
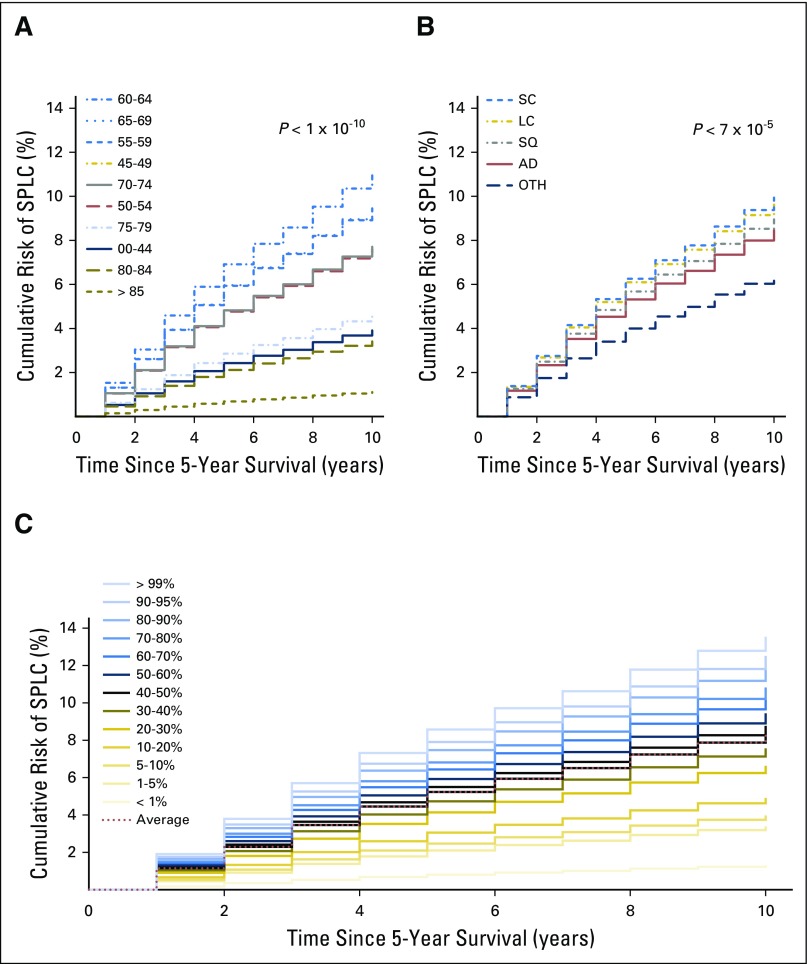
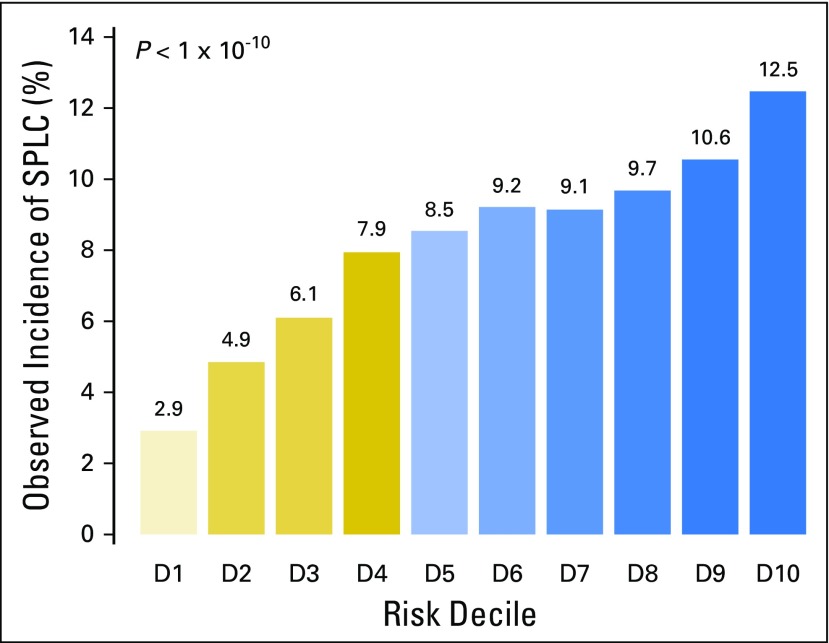
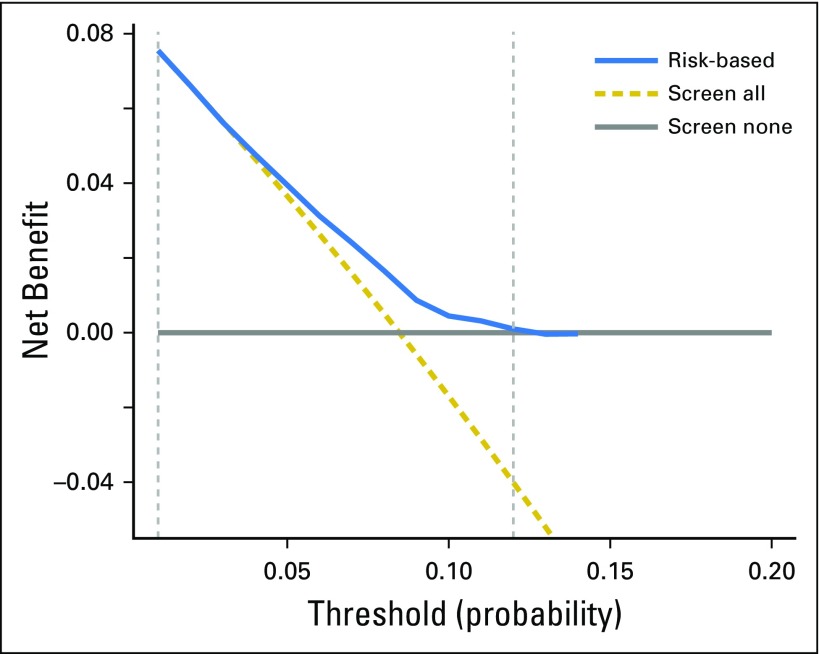
Purpose This study estimated the 10-year risk of developing second primary lung cancer (SPLC) among survivors of initial primary lung cancer (IPLC) and evaluated the clinical utility of the risk prediction model for selecting eligibility criteria for screening. Methods SEER data were used to identify a population-based cohort of 20,032 participants diagnosed with IPLC between 1988 and 2003 and who survived ≥ 5 years after the initial diagnosis. We used a proportional subdistribution hazards model to estimate the 10-year risk of developing SPLC among survivors of lung cancer LC in the presence of competing risks. Considered predictors included age, sex, race, treatment, histology, stage, and extent of disease. We examined the risk-stratification ability of the prediction model and performed decision curve analysis to evaluate the clinical utility of the model by calculating its net benefit in varied risk thresholds for screening. Results Although the median 10-year risk of SPLC among survivors of LC was 8.36%, the estimated risk varied substantially (range, 0.56% to 14.3%) when stratified by age, histology, and extent of IPLC in the final prediction model. The stratification by deciles of estimated risk showed that the observed incidence of SPLC was significantly higher in the tenth-decile group (12.5%) versus the first-decile group (2.9%; P < 10-10). The decision curve analysis yielded a range of risk thresholds (1% to 11.5%) at which the clinical net benefit of the risk model was larger than those in hypothetical all-screening or no-screening scenarios. Conclusion The risk stratification approach in SPLC can be potentially useful for identifying survivors of LC to be screened by computed tomography. More comprehensive environmental and genetic data may help enhance the predictability and stratification ability of the risk model for SPLC.
Figures

Comment in
-
Can population data guide surveillance strategies for second primary lung cancers?Transl Lung Cancer Res. 2018 Feb;7(Suppl 1):S25-S27. doi: 10.21037/tlcr.2017.12.13. Transl Lung Cancer Res. 2018. PMID: 29531899 Free PMC article. No abstract available.
-
Long-term CT surveillance after primary lung cancer treatment captures events in all risk groups.Transl Lung Cancer Res. 2018 Feb;7(Suppl 1):S49-S53. doi: 10.21037/tlcr.2018.01.10. Transl Lung Cancer Res. 2018. PMID: 29531905 Free PMC article. No abstract available.
-
The risk of second primary lung cancer: an unsolved dilemma.Transl Lung Cancer Res. 2018 Feb;7(Suppl 1):S54-S56. doi: 10.21037/tlcr.2018.01.13. Transl Lung Cancer Res. 2018. PMID: 29531906 Free PMC article. No abstract available.
-
Response to Letter to the Editor: Caution Needed for Analyzing the Risks of Second Cancers.J Thorac Oncol. 2018 Sep;13(9):e173-e174. doi: 10.1016/j.jtho.2018.05.007. J Thorac Oncol. 2018. PMID: 30166016 No abstract available.
References
-
- Siegel R, Ma J, Zou Z, et al. : Cancer statistics, 2014. CA Cancer J Clin 64:9-29, 2014 - PubMed
-
- Siegel R, DeSantis C, Virgo K, et al. : Cancer treatment and survivorship statistics, 2012. CA Cancer J Clin 62:220-241, 2012 - PubMed
-
- Surapaneni R, Singh P, Rajagopalan K, et al. : Stage I lung cancer survivorship: Risk of second malignancies and need for individualized care plan. J Thorac Oncol 7:1252-1256, 2012 - PubMed
-
- Moyer VA, U.S. Preventive Services Task Force : Screening for lung cancer: U.S. Preventive Services Task Force recommendation statement. Ann Intern Med 160:330-338, 2014 - PubMed
MeSH terms
Grants and funding
LinkOut - more resources
Full Text Sources
Other Literature Sources
Medical
