. 2017 Sep 6;45(15):9093-9107.
doi: 10.1093/nar/gkx536.

ALG-5 is a miRNA-associated Argonaute required for proper developmental timing in the Caenorhabditis elegans germline

Affiliations

ALG-5 is a miRNA-associated Argonaute required for proper developmental timing in the Caenorhabditis elegans germline

Kristen C Brown et al. Nucleic Acids Res. .

Abstract

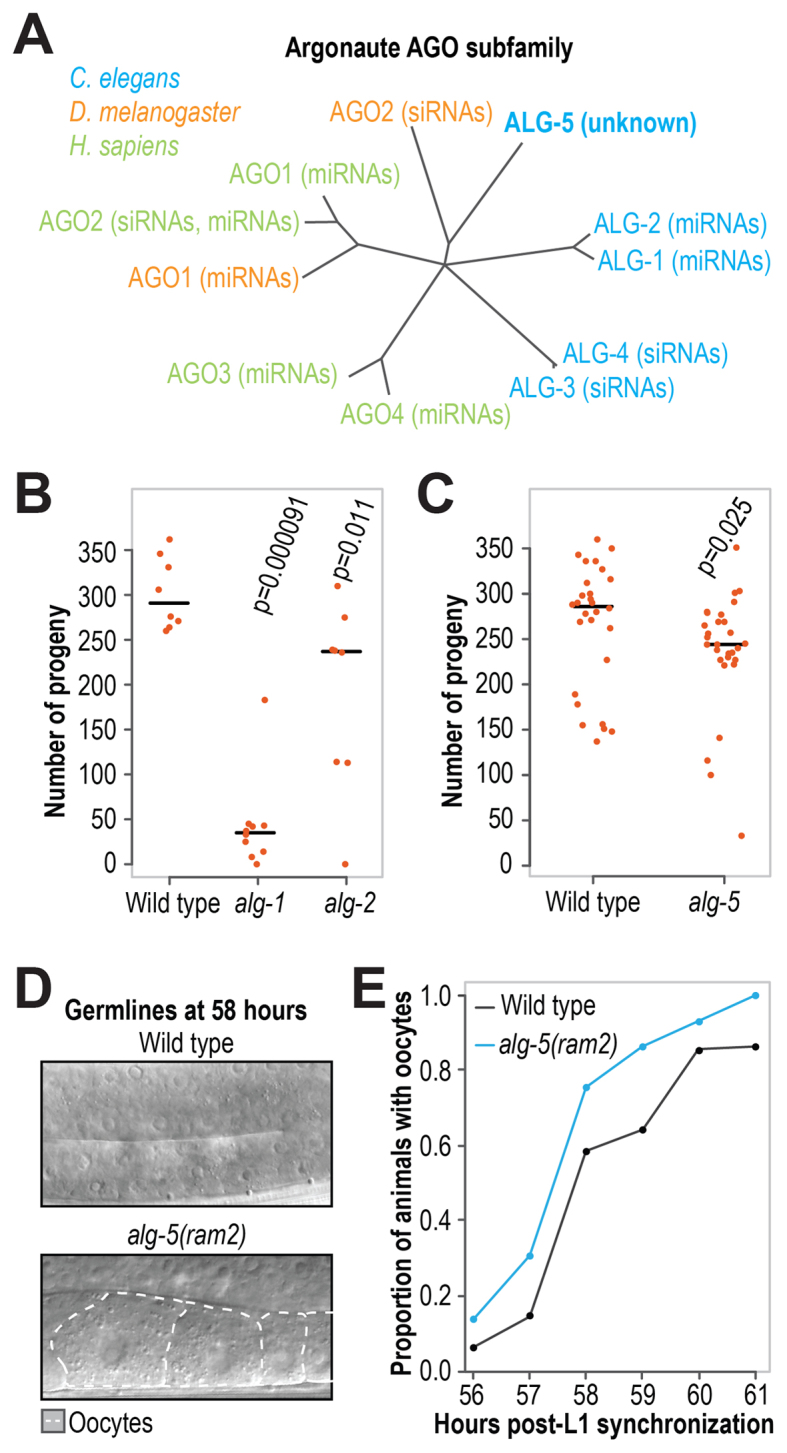
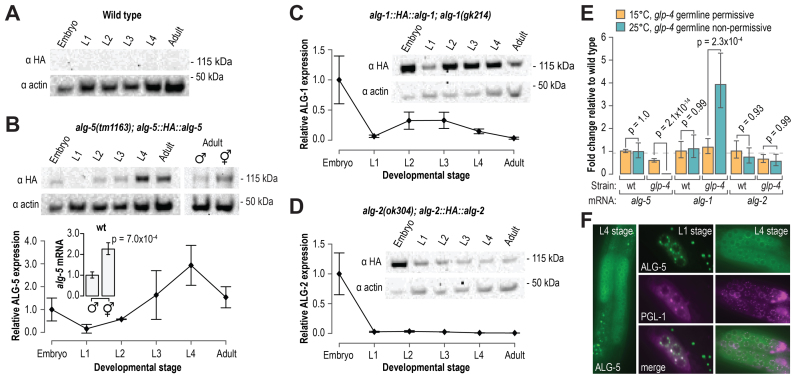
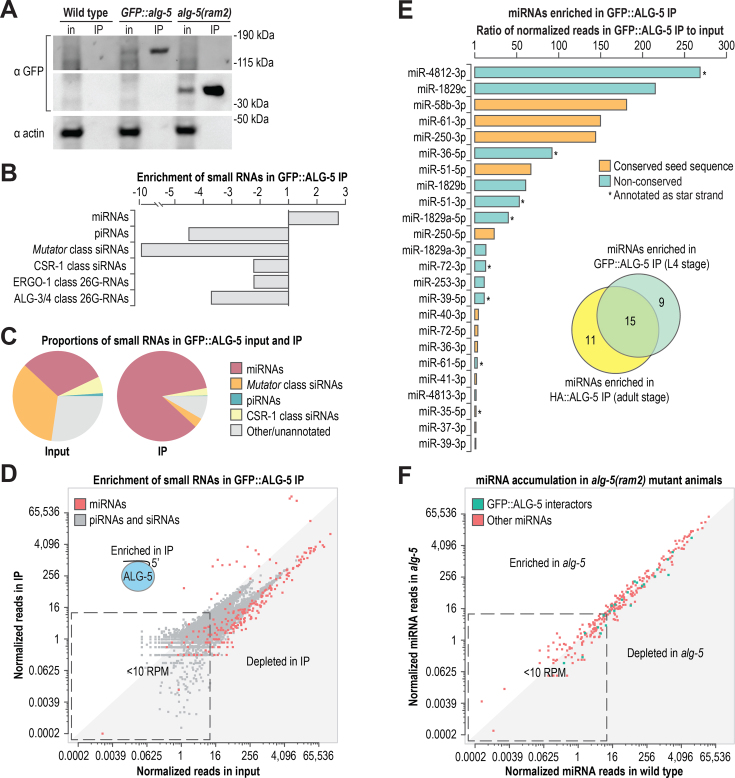
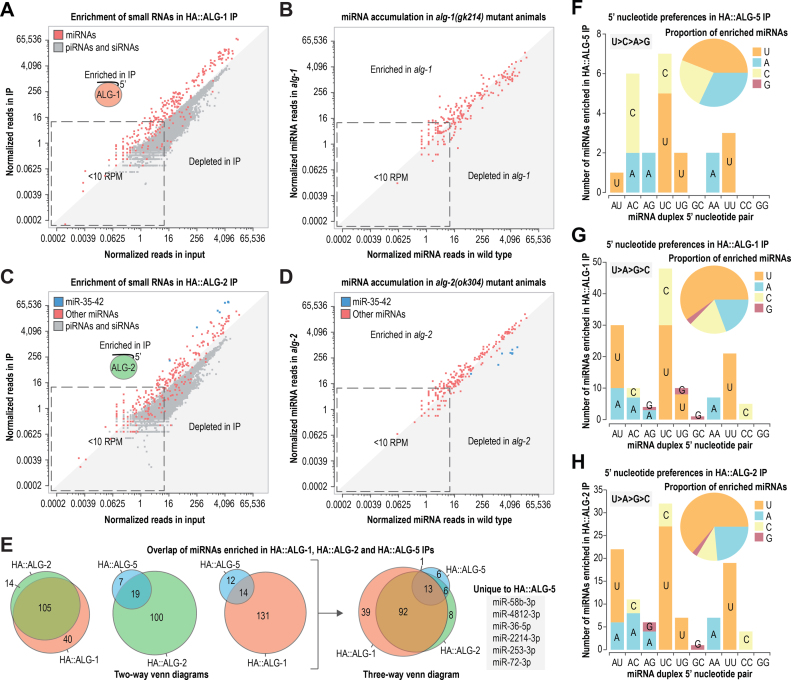
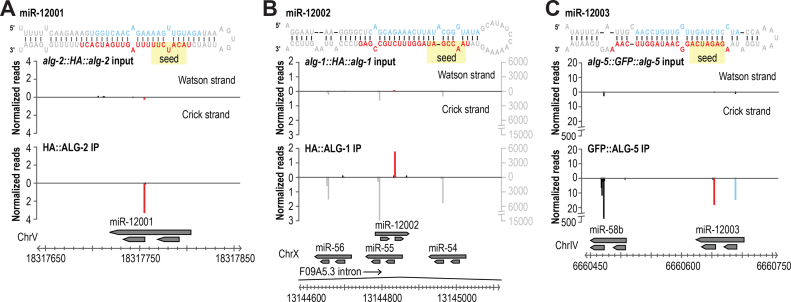
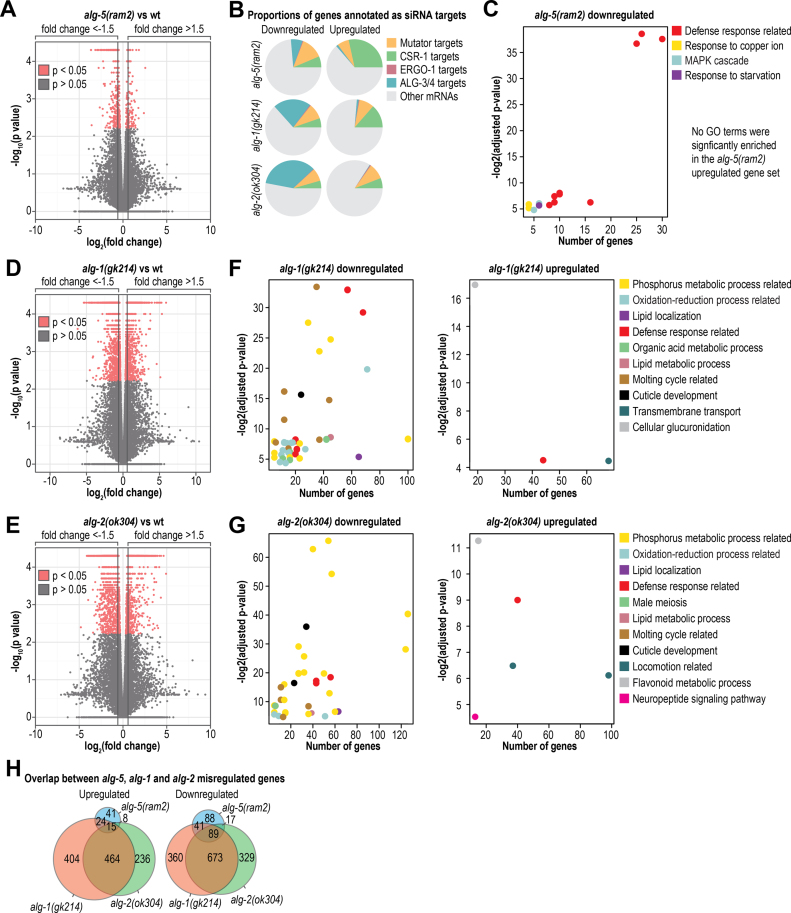
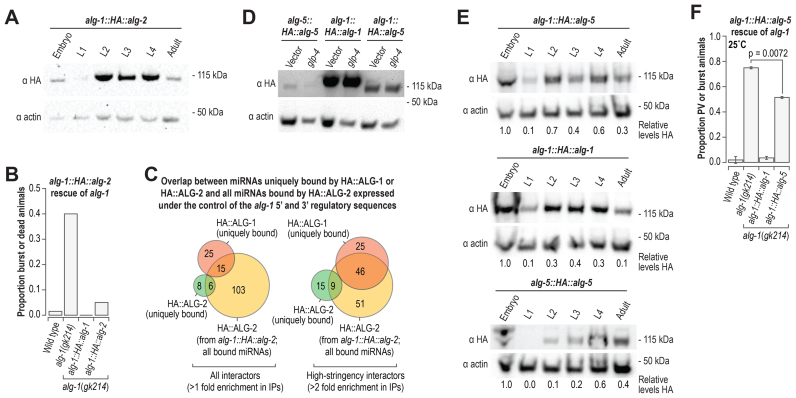
Caenorhabditis elegans contains 25 Argonautes, of which, ALG-1 and ALG-2 are known to primarily interact with miRNAs. ALG-5 belongs to the AGO subfamily of Argonautes that includes ALG-1 and ALG-2, but its role in small RNA pathways is unknown. We analyzed by high-throughput sequencing the small RNAs associated with ALG-5, ALG-1 and ALG-2, as well as changes in mRNA expression in alg-5, alg-1 and alg-2 mutants. We show that ALG-5 defines a distinct branch of the miRNA pathway affecting the expression of genes involved in immunity, defense, and development. In contrast to ALG-1 and ALG-2, which associate with most miRNAs and have general roles throughout development, ALG-5 interacts with only a small subset of miRNAs and is specifically expressed in the germline where it localizes alongside the piRNA and siRNA machinery at P granules. alg-5 is required for optimal fertility and mutations in alg-5 lead to a precocious transition from spermatogenesis to oogenesis. Our results provide a near-comprehensive analysis of miRNA-Argonaute interactions in C. elegans and reveal a new role for miRNAs in the germline.


Figures

Figure 1.
Figure 1.
ALG-5 is required for optimal fertility and proper timing of oogenesis. (A) Phylogenetic tree of the AGO subfamily in worms, flies and humans. (B) Numbers of viable progeny produced by wild type (n = 8), alg-1(gk214) (n = 10) and alg-2(ok304) (n = 8) at 20°C. (C) Numbers of viable progeny produced by wild type (n = 28) and alg-5(ram2) (n = 29) grown at 20°C. (D) Representative images of wild type and alg-5(ram2) mutant germlines at 58 h post-L1 synchronization. The regions where oocytes form is shown. (E) Proportions of wild type and alg-5(ram2) mutant animals with oocytes formed at 56–61 h post-L1 synchronization (n = ∼25–50). One of three independent experiments is shown (the other two experiments are shown in Supplementary Figure S1D). At 58 h, the proportion of alg-5(ram2) mutant animals with oocytes is 17–35% higher than in wild type across the three experiments. See also Supplementary Figure S1.
Figure 2.
Figure 2.
alg-5 is specifically expressed in the germline. (A) Western blot assay of HA and actin in wild type animals across developmental stages. Non-transgenic wild type animals do not express the HA epitope and are included as a negative control. (B) Western blot assay and quantification of HA::ALG-5. A blot image of one of two biological replicates is shown. Points within the plot represent average signal intensity of HA normalized to actin (embryo sample arbitrarily set to 1.0). Error bars represent standard deviations from the mean. A western blot assay of HA::ALG-5 in hermaphrodites and males is also shown. The bar plot displays relative levels of endogenous alg-5 mRNA in wild type animals, as determined by quantitative RT-PCR, in hermaphrodites and males. (C and D) Western blot assay and quantification of HA::ALG-1 (C) and HA::ALG-2 (D). Points within the plots represent average signal intensity of HA normalized to actin (embryo sample arbitrarily set to 1.0). Error bars represent standard deviations from the mean. (E) Average fold change in alg-5, alg-1 and alg-2 transcript levels in wild type and glp-4(bn2) at 15°C (orange) and 25°C (teal), as determined by quantitative RT-PCR. Error bars represent standard deviations from the means for three biological replicates. (F) Representative images of GFP::ALG-5 and RFP::PGL-1. Images are of GFP or RFP fluorescence in the germline regions of living animals. See also Supplementary Figure S2.
Figure 3.
Figure 3.
ALG-5 binds a subset of miRNAs. (A) Western blot assay of GFP::ALG-5 from cell lysates (input, in) and co-IPs (IP) used for small RNA isolation and sequencing. Wild type and alg-5(ram2) were included as controls. ∼0.2% starting material equivalents for the input fractions and ∼5% starting material equivalents for the co-IP fractions were run on the gels for western blots. (B) Enrichment of miRNAs, piRNAs, and siRNAs in GFP::ALG-5 co-IP relative to input as determined by high-throughput sequencing. (C) The relative proportions of each class of small RNAs in input and co-IP fractions. (D) Normalized reads (reads per million total mapped reads) for each miRNA in GFP::ALG-5 co-IP versus input are shown in red. Normalized reads for other classes of small RNAs (piRNAs and siRNA loci) are shown in gray. (E) miRNAs enriched >1-fold in the GFP::ALG-5 co-IP relative to input. Colors indicate if the seed sequence (positions 2–8) is conserved in Drosophila melanogaster and/or Homo sapiens. Asterisks indicate if the sequence is annotated as a star strand in miRBase v. 20. The inset Venn diagram displays the overlap in miRNAs enriched in the GFP::ALG-5 (L4 stage animals) and HA::ALG-5 (adult animals) co-IPs. (F) Normalized reads for each miRNA in alg-5(ram2) versus wild type. See also Supplementary Figure S3 and Tables S3–S5.
Figure 4.
Figure 4.
Overlap between miRNAs associated with ALG-5, ALG-1 and ALG-2. (A) Normalized reads for each miRNA in HA::ALG-1 co-IP versus input are shown in red. Normalized reads for other classes of small RNAs (piRNAs and siRNA loci) are shown in gray. (B) Normalized reads for each miRNA in alg-1(gk214) versus wild type. (C) Normalized reads for each miRNA in HA::ALG-2 co-IP versus input are shown in blue or red. Normalized reads for other classes of small RNAs (piRNAs and siRNA loci) are shown in gray. (D) Normalized reads for each miRNA in alg-2(ok304) versus wild type. (E) Overlap of miRNAs enriched in HA::ALG-1 and HA::ALG-2 co-IPs >1-fold and HA::ALG-5 IP >2-fold (data from adult stage animals). (F-H) Numbers of miRNAs enriched in HA::ALG-5 (F), HA::ALG-1 (G) and HA::ALG-2 (H) co-IPs categorized by 5′ nt. miRNAs are categorized by their 5′ nt and the 5′ nt of the opposing strand of the miRNA duplex. Only miRNA duplexes for which at least one strand was enriched in the corresponding co-IP are shown. Each bar corresponds to the total number of miRNA duplexes with each 5′ nt combination and each 5′ nt is shaded in a different color. See also Supplementary Figure S4 and Tables S3–S5.
Figure 5.
Figure 5.
New miRNAs identified from Argonaute co-IPs. (AC) miRNAs were identified by MirDeep2 using high-throughput sequencing data from GFP::ALG-5, HA::ALG-1 and HA::ALG-2 co-IPs. Small RNA distribution across each new miRNA locus in the co-IP library from which it was discovered and the corresponding input library. Names arbitrarily assigned and may differ in miRBase.
Figure 6.
Figure 6.
mRNA-seq analysis of differential gene expression in alg-5, alg-1 and alg-2 mutants. (A) Volcano plot displaying differential gene expression between alg-5(ram2) mutants and wild type animals (n = 3 replicate pools). (B) The proportions of genes misregulated in each of the Argonaute mutants that are also characterized as siRNA targets. (C) DAVID analysis of significantly enriched gene ontology terms amongst the genes misregulated in alg-5(ram2) mutants. Gene ontology categories are plotted as a function of the P value for enrichment and the number of genes associated with the gene ontology term. Some gene ontology terms overlap in associated genes by >50% and were collapsed into a more general category, as indicated in the key (e.g. ‘Defense response related’). (D) Volcano plot displaying differential gene expression between alg-1(gk214) mutants and wild type animals (n = 3 replicate pools). (E) Volcano plot displaying differential gene expression between alg-2(ok304) mutants and wild type animals (n = 3 replicate pools). (F) Same as in C but alg-1(gk214). (G) Same as in C but alg-2(ok304). (H) Overlap in misregulated genes in each of the Argonaute mutants. See also Supplementary Figure S5 and Tables S6–S16.
Figure 7.
Figure 7.
Functional overlap of alg-5, alg-1 and alg-2. (A) Western blot assay of HA::ALG-2 derived from a chimeric construct containing alg-1 5′ and 3′ regulatory sequence and alg-2 coding sequence (alg-1::HA::alg-2). Actin is shown as a loading control. (B) Proportion of burst or dead animals. Wild type (n = 152), alg-1(gk214) (n = 114), alg-1::HA::alg-1; alg-1(gk214) (n = 116), and alg-1::HA::alg-2; alg-1(gk214) (n = 92) animals were grown at 20°C. (C) Overlap of miRNAs enriched >1-fold (left) and >2-fold (right) in co-IP of HA::ALG-2 derived from alg-1::HA::alg-2; alg-1(gk214) with miRNAs uniquely enriched in co-IPs from HA::ALG-1 (alg-1::HA::alg-1; alg-1(gk214)) or HA::ALG-2 (alg-2::HA::alg-2; alg-2(ok304)) co-IPs >1-fold (left) and >2-fold (right). (D) Western blot assay of HA::ALG-5 derived from a construct containing the authentic alg-5 regulatory elements in the alg-5(tm1163) mutant background (alg-5(tm1163); alg-5::HA::alg-5) and a chimeric construct containing alg-1 5′ and 3′ regulatory sequences and alg-5 coding sequence in the alg-1(gk214) mutant background (alg-1::HA::alg-5; alg-1(gk214)). HA::ALG-1 from alg-1::HA::alg-1 in the alg-1(gk214) mutant background is also shown. Actin is shown as a loading control. glp-4 RNAi was done to reduce germ cell proliferation during development. L4440 vector RNAi was done as a control. (E) A developmental time course of HA::ALG-5 from alg-1::HA::alg-5; alg-1(gk214) (upper panel) and alg-5(tm1163); alg-5::HA::alg-5 (lower panel) and HA::ALG-1 from alg-1::HA::alg-1; alg-1(gk214) (middle panel). Actin is shown as a loading control. Numbers below blot images are signal intensities of HA normalized to actin (embryo samples arbitrarily set to 1.0). (F) Proportions of animals containing protruding or burst vulvas. Error bars represent standard deviations from the means from two independent experiments. Wild type (n = 104–124), alg-1(gk214) (n = 102–109), alg-1::HA::alg-1; alg-1(gk214) (n = 109–114) and alg-1::HA::alg-5; alg-1(gk214) (n = 102–116) animals were grown at 25°C See also Supplementary Figure S6.

References

    1. Bartel D.P. MicroRNAs: genomics, biogenesis, mechanism, and function. Cell. 2004; 116:281–297. - PubMed
    1. Lim L.P., Lau N.C., Weinstein E.G., Abdelhakim A., Yekta S., Rhoades M.W., Burge C.B., Bartel D.P.. The microRNAs of Caenorhabditis elegans. Genes Dev. 2003; 17:991–1008. - PMC - PubMed
    1. Lee Y., Ahn C., Han J., Choi H., Kim J., Yim J., Lee J., Provost P., Radmark O., Kim S. et al. The nuclear RNase III Drosha initiates microRNA processing. Nature. 2003; 425:415–419. - PubMed
    1. Khvorova A., Reynolds A., Jayasena S.D.. Functional siRNAs and miRNAs exhibit strand bias. Cell. 2003; 115:209–216. - PubMed
    1. Schwarz D.S., Hutvagner G., Du T., Xu Z., Aronin N., Zamore P.D.. Asymmetry in the assembly of the RNAi enzyme complex. Cell. 2003; 115:199–208. - PubMed

MeSH terms