

UpSetR: an R package for the visualization of intersecting sets and their properties
- PMID: 28645171
- PMCID: PMC5870712
- DOI: 10.1093/bioinformatics/btx364
UpSetR: an R package for the visualization of intersecting sets and their properties
Abstract
Motivation: Venn and Euler diagrams are a popular yet inadequate solution for quantitative visualization of set intersections. A scalable alternative to Venn and Euler diagrams for visualizing intersecting sets and their properties is needed.
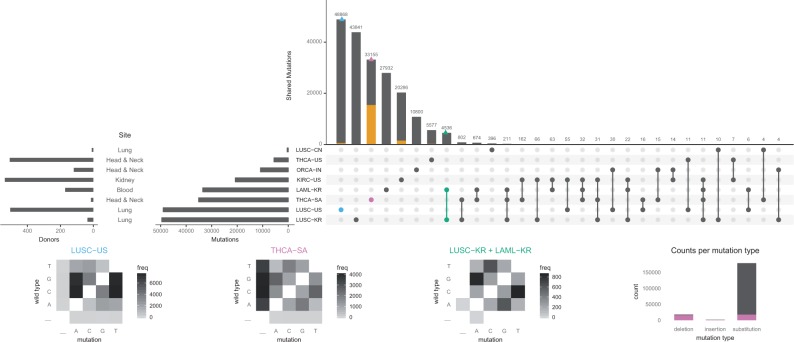
Results: We developed UpSetR, an open source R package that employs a scalable matrix-based visualization to show intersections of sets, their size, and other properties.
Availability and implementation: UpSetR is available at https://github.com/hms-dbmi/UpSetR/ and released under the MIT License. A Shiny app is available at https://gehlenborglab.shinyapps.io/upsetr/ .
Contact: nils@hms.harvard.edu.
Supplementary information: Supplementary data are available at Bioinformatics online.
© The Author(s) 2017. Published by Oxford University Press.
Figures
References
-
- Alsallakh B. et al. (2016) The State-of-the-Art of Set Visualization. Computer Graphics Forum, 35: 234–260.
-
- Cleveland W.S., McGill R. (1984) Graphical perception: Theory, experimentation, and application to the development of graphical methods. J. Am. Stat. Assoc, 79, 531–554.
-
- D’Hont A. et al. (2012) The banana (musa acuminata) genome and the evolution of monocotyledonous plants. Nature, 488, 213–217. - PubMed
-
- Lex A., Gehlenborg N. (2014) Sets & intersections. Nat. Methods, 11, 779. - PubMed
MeSH terms
Grants and funding
LinkOut - more resources
Full Text Sources
Other Literature Sources
