. 2017 Sep 1;102(9):3327-3339.
doi: 10.1210/jc.2017-00947.

AKR1C3-Mediated Adipose Androgen Generation Drives Lipotoxicity in Women With Polycystic Ovary Syndrome

Affiliations

AKR1C3-Mediated Adipose Androgen Generation Drives Lipotoxicity in Women With Polycystic Ovary Syndrome

Michael W O'Reilly et al. J Clin Endocrinol Metab. .

Abstract

Context: Polycystic ovary syndrome (PCOS) is a prevalent metabolic disorder occurring in up to 10% of women of reproductive age. PCOS is associated with insulin resistance and cardiovascular risk. Androgen excess is a defining feature of PCOS and has been suggested as causally associated with insulin resistance; however, mechanistic evidence linking both is lacking. We hypothesized that adipose tissue is an important site linking androgen activation and metabolic dysfunction in PCOS.

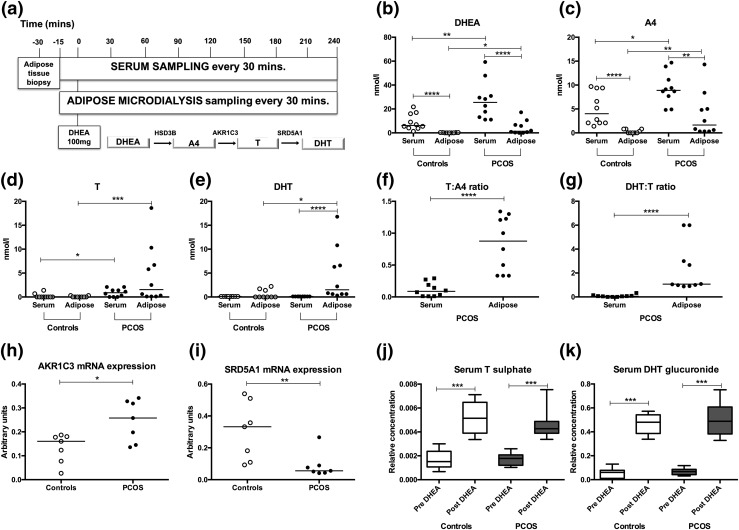
Methods: We performed a human deep metabolic in vivo phenotyping study examining the systemic and intra-adipose effects of acute and chronic androgen exposure in 10 PCOS women, in comparison with 10 body mass index-matched healthy controls, complemented by in vitro experiments.

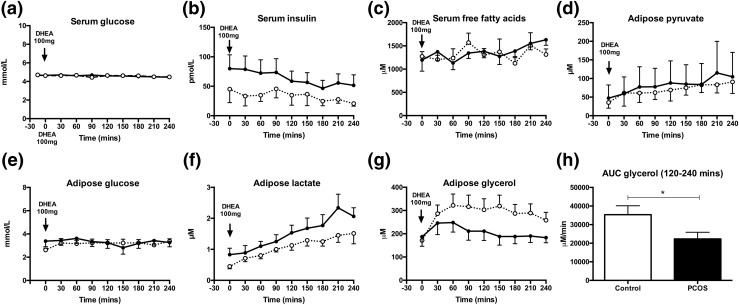
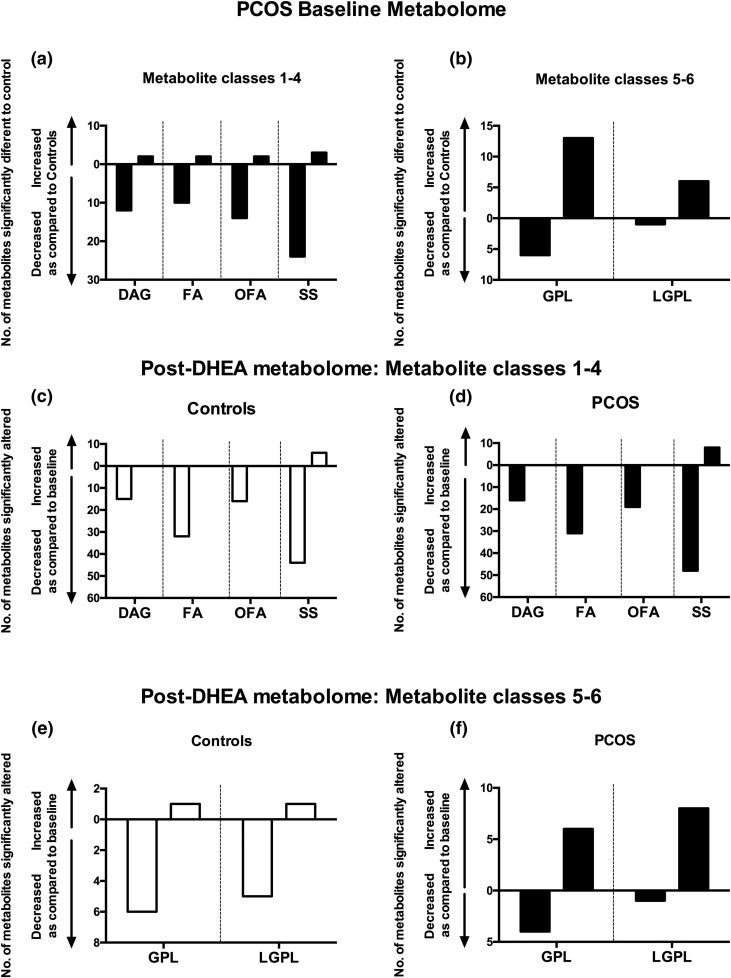
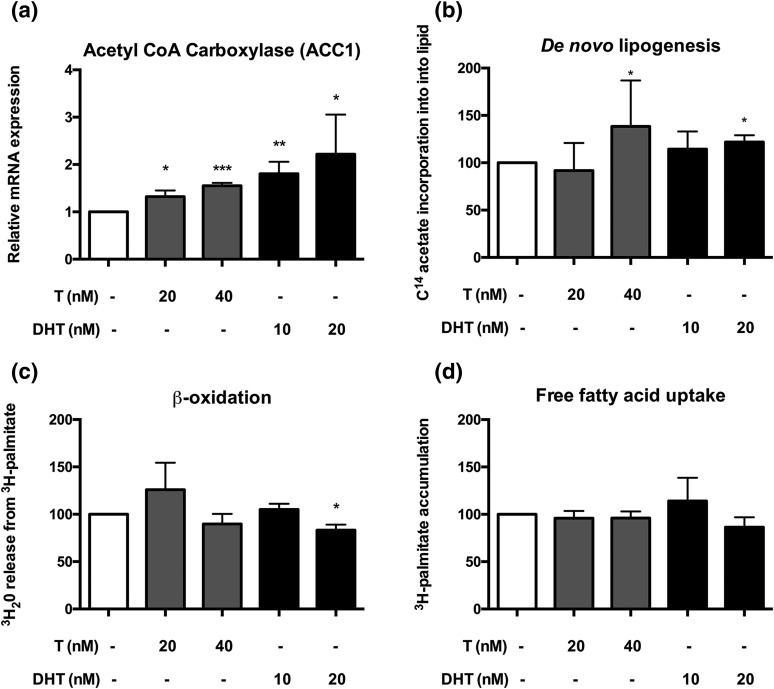
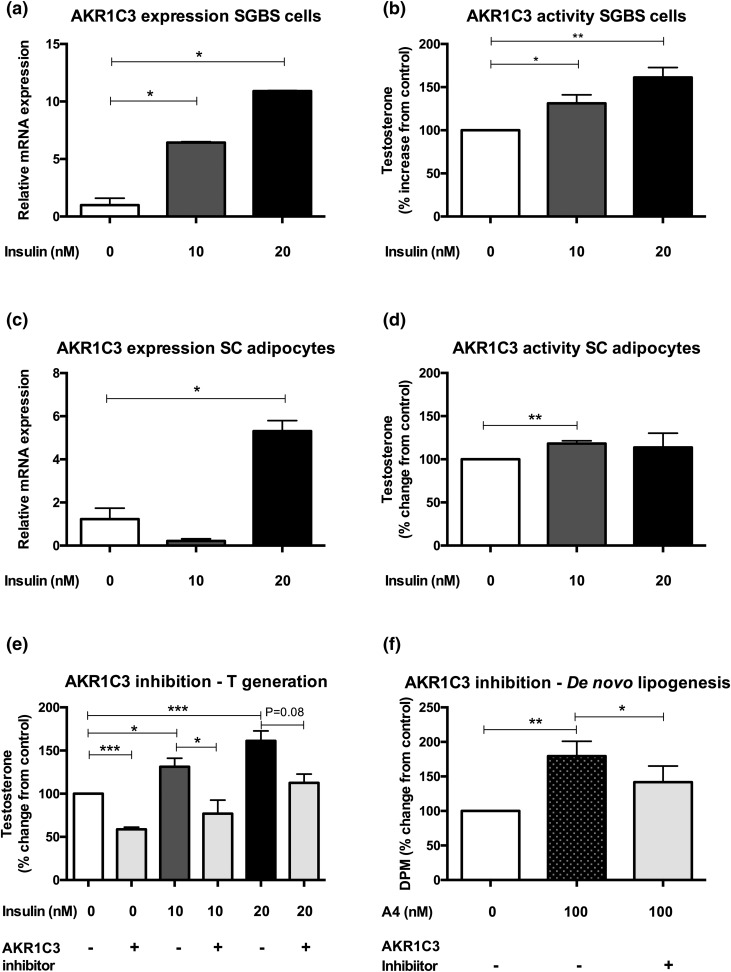
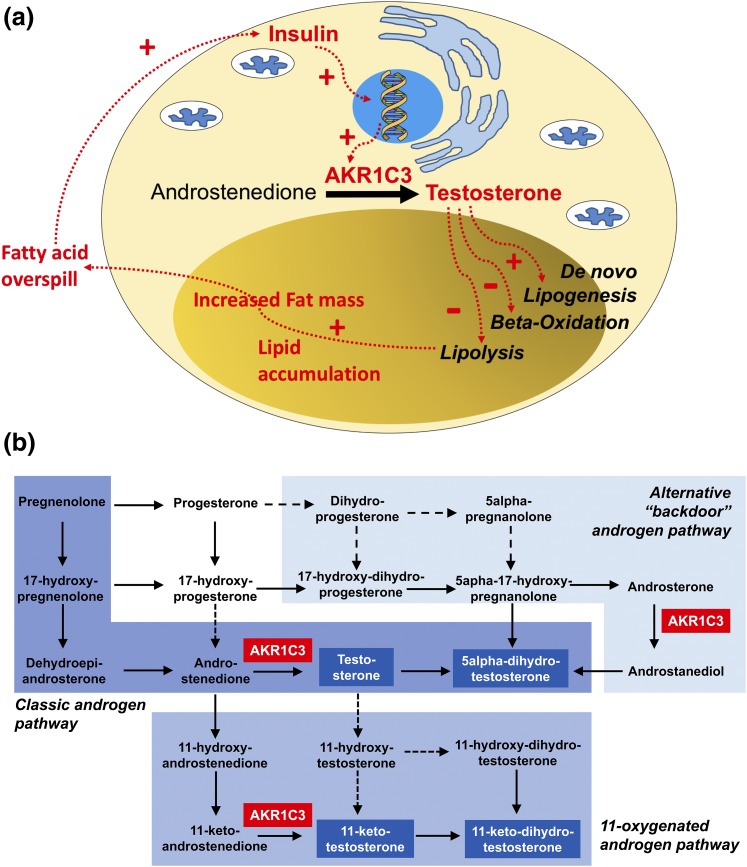
Results: PCOS women had increased intra-adipose concentrations of testosterone (P = 0.0006) and dihydrotestosterone (P = 0.01), with increased expression of the androgen-activating enzyme aldo-ketoreductase type 1 C3 (AKR1C3) (P = 0.04) in subcutaneous adipose tissue. Adipose glycerol levels in subcutaneous adipose tissue microdialysate supported in vivo suppression of lipolysis after acute androgen exposure in PCOS (P = 0.04). Mirroring this, nontargeted serum metabolomics revealed prolipogenic effects of androgens in PCOS women only. In vitro studies showed that insulin increased adipose AKR1C3 expression and activity, whereas androgen exposure increased adipocyte de novo lipid synthesis. Pharmacologic AKR1C3 inhibition in vitro decreased de novo lipogenesis.

Conclusions: These findings define an intra-adipose mechanism of androgen activation that contributes to adipose remodeling and a systemic lipotoxic metabolome, with intra-adipose androgens driving lipid accumulation and insulin resistance in PCOS. AKR1C3 represents a promising therapeutic target in PCOS.


Figures

Figure 1.
Figure 1.
Circulating androgens and in vivo intra-adipose tissue androgen synthesis in PCOS (n = 10) and age- and BMI-matched healthy controls (n = 10). (a) Deep metabolic in vivo phenotyping protocol with serum and adipose microdialysate sampling every 30 minutes for 4 hours. After baseline sampling, an acute androgen challenge was administered by oral intake of a 100-mg dose of the androgen precursor DHEA at 0 minutes; schematic represents the classic androgen synthesis pathway from DHEA to active androgens. (b–e) Serum and in vivo intra-adipose concentrations of DHEA, A4, T, and 5α-DHT in controls (○) and PCOS women (●). Lines represent the median of each group. (f and g) Steroid ratios reflective of the conversion of A4 to T (T:A4) and the conversion of T to DHT (DHT:T) as measured in serum and adipose tissue microdialysate of PCOS women. Black squares represent PCOS serum. Lines represent the median of each group. (h and i) Relative messenger RNA expression of the androgen-generating enzymes AKR1C3 (converting A4 to T) and SRD5A1 (converting T to DHT) in subcutaneous abdominal adipose tissue from PCOS and controls (n = 7 for each). Lines represent the median of each group. (j and k) Serum T sulfate and DHT glucuronide concentrations before and 150 minutes after oral administration of the androgen precursor DHEA. Boxes represent median and 25th to 75th percentile, and whiskers represent 10th and 90th percentile. Significance levels: *P < 0.05; **P < 0.01; ***P < 0.001; ****P < 0.0001 (Mann-Whitney U test). All steroid concentrations were measured by mass spectrometry–based assays. mRNA, messenger RNA.
Figure 2.
Figure 2.
Impact of acute oral androgen challenge (DHEA 100 mg) on in vivo metabolic markers in serum and adipose tissue microdialysate. Serum glucose, insulin, and free fatty acids (a–c) and intra-adipose pyruvate, glucose, lactate, and glycerol levels (d–g) in PCOS (n = 10, dark line, ●) and control women (n = 10, dotted line, ○ across the DHEA challenge test) (mean ± standard error of the mean). Time of oral administration of 100 mg DHEA indicated by arrow. (h) AUC for glycerol between 120 and 240 minutes after androgen exposure in the PCOS group compared with controls. *P < 0.05 (Mann-Whitney U test). For further details see Supplemental Methods.
Figure 3.
Figure 3.
Baseline differences and changes induced in the nontargeted serum metabolome by acute androgen exposure in women with PCOS (n = 10) and age- and BMI-matched healthy control women (n = 10). (a) The number of serum metabolites associated with lipid and steroid metabolism observed to be significantly different (P < 0.01) at baseline between control and PCOS subjects. (b) Significantly different GPL and LGPL metabolites between PCOS women and controls at baseline. (c and d) Metabolic responses lipid and steroid metabolite after exposure of controls and PCOS subjects to an acute androgen challenge (DHEA 100 mg administered orally at 0 minutes; serum metabolome analysis carried out with 150-minute serum sample, representative of the maximum of circulating androgen concentrations after DHEA). (e and f) Differential response of GPLs and LGPLs to the acute DHEA challenge in comparison of controls and PCOS women. Data matrix analyzed applying univariate (Wilcoxon signed-rank test) after normalization to total ion current per sample. DAG, diacylglyceride; FA, fatty acid; OFA, oxidized fatty acids; SS, sterols and steroid metabolites.
Figure 4.
Figure 4.
The effects of androgens on adipose lipid metabolism in the human preadipocyte SGBS cell line. (a) The effect of androgens (T, light-shaded bars; 5α-DHT, dark-shaded bars) on the messenger RNA expression of ACC1, the main provider of malonyl-CoA for fatty acid synthesis. (b) Effect of T and DHT on de novo lipogenesis, determined by incorporation of 14C acetate into lipid. (c) Effects of T and DHT on β oxidation, determined by 3H20 release from 3H-palmitate. (d) Effects of androgens on free fatty acid uptake. All data are presented as the mean ± standard error of the mean of the three to five experiments. Significance levels: *P < 0.05; **P < 0.01; ***P < 0.001 compared with control (analysis of variance with post hoc Tukey test). mRNA, messenger RNA.
Figure 5.
Figure 5.
Expression, activity, and inhibition of the androgen-activating enzyme AKR1C3 in subcutaneous adipose tissue. (a–d) Expression and activity of AKR1C3 with and without insulin stimulation in the human preadipocyte SGBS cell line and primary subcutaneous adipocytes from women undergoing elective surgery. (e) Effect of pharmacologic AKR1C3 inhibition by 3-4-trifluoromethyl-phenylamino-benzoic acid (10 μM) for 24 hours (gray bars) on adipose androgen generation, assessed as conversion of A4 to testosterone. (f) Impact of pharmacologic AKR1C3 inhibition on A4-mediated de novo lipogenesis. All data are presented as the mean ± standard error of the mean of 3 to 5 experiments. Significance levels: *P < 0.05; **P < 0.01; ***P < 0.001 (analysis of variance with Tukey post hoc test).
Figure 6.
Figure 6.
(a) Schematic representation of the proposed mechanistic link between AE, insulin resistance, and lipotoxicity in PCOS, and (b) graphical representation of the major human androgen biosynthesis pathways. AKR1C3 plays a central gatekeeping role in androgen activation in the classic androgen synthesis pathway and the alternative (backdoor) pathway to 5α-DHT and the 11-oxygenated androgen synthesis pathway. Active androgens capable of activating the androgen receptor highlighted in blue boxes and white font.

References

    1. Randeva HS, Tan BK, Weickert MO, Lois K, Nestler JE, Sattar N, Lehnert H. Cardiometabolic aspects of the polycystic ovary syndrome. Endocr Rev. 2012;33(5):812–841. - PMC - PubMed
    1. Franks S. Polycystic ovary syndrome. N Engl J Med. 1995;333(13):853–861. - PubMed
    1. Yildiz BO, Bozdag G, Yapici Z, Esinler I, Yarali H. Prevalence, phenotype and cardiometabolic risk of polycystic ovary syndrome under different diagnostic criteria. Hum Reprod. 2012;27(10):3067–3073. - PubMed
    1. Dunaif A. Insulin resistance and the polycystic ovary syndrome: mechanism and implications for pathogenesis. Endocr Rev. 1997;18(6):774–800. - PubMed
    1. Roe A, Hillman J, Butts S, Smith M, Rader D, Playford M, Mehta NN, Dokras A. Decreased cholesterol efflux capacity and atherogenic lipid profile in young women with PCOS. J Clin Endocrinol Metab. 2014;99(5):E841–E847. - PMC - PubMed

Publication types

MeSH terms